|
Download Data (XLS File) |
|
||||||||
|
||||||||
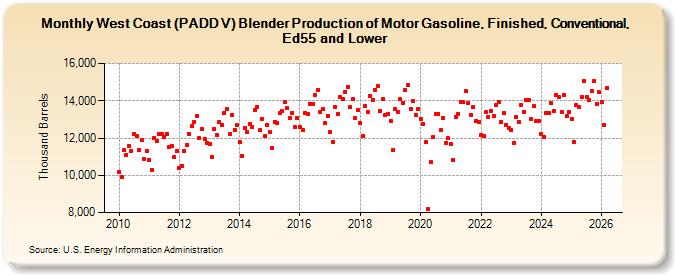
| West Coast (PADD V) Blender Production of Motor Gasoline, Finished, Conventional, Ed55 and Lower (Thousand Barrels) | ||||||||
| Year | Jan | Feb | Mar | Apr | May | Jun | Jul | Aug | Sep | Oct | Nov | Dec |
|---|---|---|---|---|---|---|---|---|---|---|---|---|
| 2010 | 10,187 | 9,907 | 11,331 | 11,102 | 11,550 | 11,327 | 12,238 | 12,096 | 11,369 | 11,868 | 10,894 | 11,319 |
| 2011 | 10,825 | 10,308 | 12,025 | 11,851 | 12,227 | 12,218 | 12,054 | 12,231 | 11,501 | 11,582 | 10,989 | 11,301 |
| 2012 | 10,405 | 10,522 | 11,287 | 11,631 | 12,227 | 12,641 | 12,876 | 13,190 | 11,986 | 12,503 | 11,962 | 11,743 |
| 2013 | 11,670 | 10,976 | 12,504 | 12,163 | 12,851 | 12,718 | 13,365 | 13,543 | 12,204 | 13,249 | 12,449 | 12,685 |
| 2014 | 11,800 | 11,009 | 12,522 | 12,302 | 12,775 | 12,586 | 13,500 | 13,688 | 12,438 | 13,047 | 12,125 | 12,705 |
| 2015 | 12,305 | 11,463 | 12,878 | 12,782 | 13,361 | 13,425 | 13,919 | 13,607 | 13,048 | 13,348 | 12,567 | 13,062 |
| 2016 | 12,591 | 12,439 | 13,366 | 13,265 | 13,833 | 13,813 | 14,331 | 14,561 | 13,402 | 13,534 | 12,832 | 13,187 |
| 2017 | 12,328 | 11,793 | 13,639 | 13,294 | 14,175 | 14,114 | 14,491 | 14,759 | 13,648 | 14,103 | 13,056 | 13,519 |
| 2018 | 12,819 | 12,094 | 13,724 | 13,413 | 14,268 | 14,044 | 14,582 | 14,811 | 13,463 | 14,085 | 13,243 | 13,313 |
| 2019 | 12,931 | 11,360 | 13,539 | 13,383 | 14,077 | 13,865 | 14,553 | 14,857 | 13,531 | 13,995 | 13,242 | 13,567 |
| 2020 | 13,033 | 12,777 | 11,772 | 8,182 | 10,694 | 12,054 | 13,297 | 13,308 | 12,415 | 13,081 | 11,741 | 11,984 |
| 2021 | 11,677 | 10,798 | 13,152 | 13,303 | 13,930 | 13,919 | 14,535 | 13,853 | 13,229 | 13,665 | 12,920 | 12,860 |
| 2022 | 12,153 | 12,098 | 13,396 | 13,125 | 13,459 | 13,164 | 13,794 | 13,948 | 12,858 | 13,355 | 12,711 | 12,562 |
| 2023 | 12,427 | 11,721 | 13,124 | 12,864 | 13,792 | 13,372 | 14,031 | 13,989 | 12,953 | 13,724 | 12,891 | 12,906 |
| 2024 | 12,226 | |||||||||||
| - = No Data Reported; -- = Not Applicable; NA = Not Available; W = Withheld to avoid disclosure of individual company data. |
| Release Date: 3/29/2024 |
| Next Release Date: 4/30/2024 |