|
Download Data (XLS File) |
|
||||||||
|
||||||||
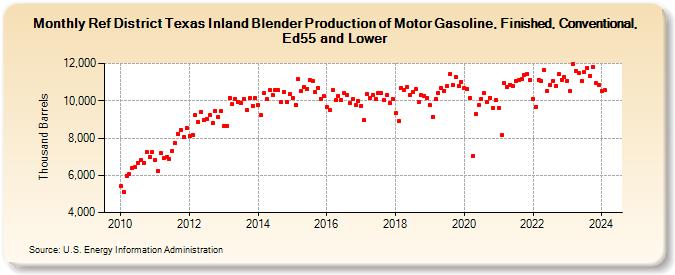
| Ref District Texas Inland Blender Production of Motor Gasoline, Finished, Conventional, Ed55 and Lower (Thousand Barrels) | ||||||||
| Year | Jan | Feb | Mar | Apr | May | Jun | Jul | Aug | Sep | Oct | Nov | Dec |
|---|---|---|---|---|---|---|---|---|---|---|---|---|
| 2010 | 5,418 | 5,122 | 5,980 | 6,047 | 6,413 | 6,439 | 6,671 | 6,796 | 6,673 | 7,246 | 7,001 | 7,234 |
| 2011 | 6,842 | 6,232 | 7,171 | 6,907 | 6,962 | 6,864 | 7,323 | 7,730 | 8,221 | 8,439 | 8,048 | 8,544 |
| 2012 | 8,106 | 8,178 | 9,219 | 8,870 | 9,409 | 8,954 | 9,029 | 9,215 | 8,818 | 9,448 | 9,116 | 9,433 |
| 2013 | 8,625 | 8,656 | 10,174 | 9,818 | 10,113 | 9,924 | 9,891 | 10,088 | 9,509 | 10,121 | 9,727 | 10,145 |
| 2014 | 9,768 | 9,225 | 10,433 | 10,106 | 10,564 | 10,333 | 10,558 | 10,552 | 9,907 | 10,443 | 9,923 | 10,349 |
| 2015 | 10,171 | 9,782 | 11,142 | 10,497 | 10,731 | 10,655 | 11,100 | 11,077 | 10,446 | 10,680 | 10,120 | 10,239 |
| 2016 | 9,647 | 9,513 | 10,566 | 10,016 | 10,265 | 10,021 | 10,391 | 10,294 | 9,858 | 10,068 | 9,759 | 9,982 |
| 2017 | 9,733 | 8,947 | 10,362 | 10,153 | 10,298 | 10,093 | 10,401 | 10,407 | 10,049 | 10,295 | 9,865 | 10,078 |
| 2018 | 9,334 | 8,894 | 10,696 | 10,558 | 10,714 | 10,317 | 10,479 | 10,610 | 9,951 | 10,321 | 10,272 | 10,160 |
| 2019 | 9,758 | 9,149 | 10,068 | 10,436 | 10,673 | 10,537 | 10,776 | 11,409 | 10,832 | 11,282 | 10,818 | 11,031 |
| 2020 | 10,669 | 10,617 | 10,153 | 7,044 | 9,264 | 9,746 | 10,086 | 10,398 | 9,934 | 10,173 | 9,625 | 10,037 |
| 2021 | 9,628 | 8,149 | 10,932 | 10,736 | 10,870 | 10,798 | 11,058 | 11,095 | 11,170 | 11,391 | 11,459 | 11,126 |
| 2022 | 10,098 | 9,679 | 11,128 | 11,042 | 11,637 | 10,541 | 10,852 | 11,066 | 10,816 | 11,417 | 11,134 | 11,271 |
| 2023 | 11,077 | 10,499 | 11,980 | 11,588 | 11,500 | 11,085 | 11,529 | 11,773 | 11,346 | 11,808 | 10,979 | 10,858 |
| 2024 | 10,518 | |||||||||||
| - = No Data Reported; -- = Not Applicable; NA = Not Available; W = Withheld to avoid disclosure of individual company data. |
| Release Date: 3/29/2024 |
| Next Release Date: 4/30/2024 |