|
Download Data (XLS File) |
|
||||||||
|
||||||||
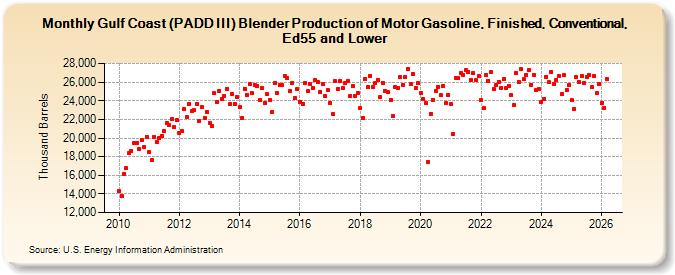
| Gulf Coast (PADD III) Blender Production of Motor Gasoline, Finished, Conventional, Ed55 and Lower (Thousand Barrels) | ||||||||
| Year | Jan | Feb | Mar | Apr | May | Jun | Jul | Aug | Sep | Oct | Nov | Dec |
|---|---|---|---|---|---|---|---|---|---|---|---|---|
| 2010 | 14,301 | 13,824 | 16,149 | 16,768 | 18,381 | 18,584 | 19,424 | 19,503 | 18,813 | 19,818 | 19,073 | 20,160 |
| 2011 | 18,465 | 17,599 | 20,129 | 19,615 | 19,982 | 20,231 | 20,700 | 21,628 | 21,362 | 21,991 | 21,149 | 21,928 |
| 2012 | 20,495 | 20,739 | 23,074 | 22,306 | 23,666 | 22,902 | 22,983 | 23,609 | 21,826 | 23,338 | 22,181 | 22,813 |
| 2013 | 21,638 | 21,249 | 24,801 | 23,919 | 25,049 | 24,196 | 24,553 | 25,269 | 23,626 | 24,751 | 23,659 | 24,381 |
| 2014 | 23,277 | 22,162 | 25,301 | 24,633 | 25,757 | 24,797 | 25,688 | 25,631 | 24,058 | 25,345 | 23,733 | 24,693 |
| 2015 | 24,118 | 22,835 | 25,882 | 24,853 | 25,738 | 25,655 | 26,680 | 26,420 | 25,006 | 25,952 | 24,274 | 25,224 |
| 2016 | 23,915 | 23,626 | 25,897 | 25,008 | 25,851 | 25,377 | 26,206 | 25,991 | 24,988 | 25,837 | 24,531 | 25,117 |
| 2017 | 23,803 | 22,581 | 26,141 | 25,272 | 26,146 | 25,340 | 25,937 | 26,100 | 24,549 | 25,590 | 24,468 | 24,849 |
| 2018 | 23,192 | 22,103 | 26,326 | 25,479 | 26,658 | 25,515 | 25,951 | 26,265 | 24,399 | 25,896 | 25,064 | 24,969 |
| 2019 | 24,060 | 22,358 | 25,440 | 25,395 | 26,574 | 25,718 | 26,517 | 27,365 | 25,831 | 26,915 | 25,345 | 25,867 |
| 2020 | 24,808 | 24,162 | 23,766 | 17,430 | 22,596 | 24,114 | 25,095 | 25,503 | 24,591 | 25,568 | 23,721 | 24,628 |
| 2021 | 23,601 | 20,463 | 26,492 | 26,397 | 26,933 | 26,739 | 27,270 | 27,125 | 26,228 | 26,964 | 26,189 | 26,655 |
| 2022 | 24,060 | 23,245 | 26,783 | 26,125 | 27,056 | 25,273 | 25,704 | 26,058 | 25,407 | 26,296 | 25,338 | 25,596 |
| 2023 | 24,769 | 23,565 | 27,095 | 26,057 | 27,357 | 26,446 | 26,814 | 27,316 | 25,769 | 26,768 | 25,147 | 25,148 |
| 2024 | 23,896 | |||||||||||
| - = No Data Reported; -- = Not Applicable; NA = Not Available; W = Withheld to avoid disclosure of individual company data. |
| Release Date: 3/29/2024 |
| Next Release Date: 4/30/2024 |