|
Download Data (XLS File) |
|
||||||||
|
||||||||
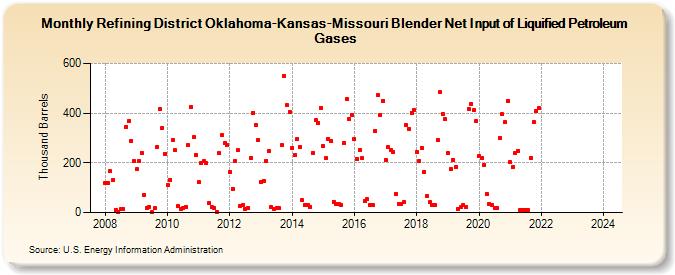
| Refining District Oklahoma-Kansas-Missouri Blender Net Input of Liquified Petroleum Gases (Thousand Barrels) | ||||||||
| Year | Jan | Feb | Mar | Apr | May | Jun | Jul | Aug | Sep | Oct | Nov | Dec |
|---|---|---|---|---|---|---|---|---|---|---|---|---|
| 2008 | 120 | 119 | 166 | 133 | 11 | 4 | 13 | 15 | 345 | 368 | 290 | 207 |
| 2009 | 174 | 206 | 241 | 71 | 20 | 23 | 1 | 18 | 265 | 417 | 342 | 237 |
| 2010 | 110 | 133 | 293 | 250 | 27 | 15 | 19 | 23 | 270 | 424 | 303 | 232 |
| 2011 | 121 | 199 | 206 | 199 | 37 | 23 | 18 | 4 | 238 | 311 | 279 | 273 |
| 2012 | 163 | 95 | 207 | 250 | 28 | 30 | 15 | 19 | 219 | 402 | 354 | 292 |
| 2013 | 122 | 129 | 208 | 246 | 22 | 15 | 17 | 17 | 270 | 548 | 431 | 405 |
| 2014 | 258 | 231 | 298 | 265 | 49 | 31 | 31 | 24 | 241 | 371 | 361 | 421 |
| 2015 | 268 | 218 | 297 | 286 | 44 | 34 | 34 | 30 | 280 | 458 | 377 | 393 |
| 2016 | 296 | 216 | 251 | 218 | 48 | 53 | 30 | 31 | 329 | 473 | 394 | 451 |
| 2017 | 211 | 262 | 253 | 242 | 74 | 35 | 35 | 41 | 353 | 338 | 402 | 413 |
| 2018 | 244 | 208 | 261 | 164 | 65 | 41 | 30 | 29 | 294 | 484 | 398 | 375 |
| 2019 | 240 | 174 | 212 | 185 | 16 | 22 | 30 | 23 | 417 | 436 | 411 | 367 |
| 2020 | 227 | 221 | 193 | 74 | 36 | 31 | 18 | 18 | 302 | 395 | 363 | 450 |
| 2021 | 202 | 183 | 240 | 249 | 11 | 10 | 9 | 10 | 220 | 365 | 408 | 419 |
| 2022 | -- | -- | -- | -- | -- | -- | -- | -- | -- | -- | -- | -- |
| 2023 | -- | -- | -- | -- | -- | -- | -- | -- | -- | -- | -- | -- |
| 2024 | -- | |||||||||||
| - = No Data Reported; -- = Not Applicable; NA = Not Available; W = Withheld to avoid disclosure of individual company data. |
| Release Date: 3/29/2024 |
| Next Release Date: 4/30/2024 |