|
Download Data (XLS File) |
|
||||||||
|
||||||||
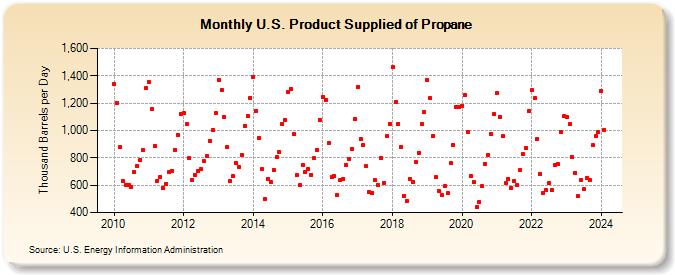
| U.S. Product Supplied of Propane (Thousand Barrels per Day) | ||||||||
| Year | Jan | Feb | Mar | Apr | May | Jun | Jul | Aug | Sep | Oct | Nov | Dec |
|---|---|---|---|---|---|---|---|---|---|---|---|---|
| 2010 | 1,341 | 1,202 | 879 | 628 | 605 | 600 | 590 | 697 | 739 | 786 | 856 | 1,311 |
| 2011 | 1,353 | 1,155 | 885 | 633 | 663 | 582 | 611 | 693 | 706 | 860 | 969 | 1,121 |
| 2012 | 1,125 | 1,044 | 798 | 641 | 676 | 706 | 716 | 774 | 815 | 924 | 1,006 | 1,126 |
| 2013 | 1,366 | 1,298 | 1,101 | 881 | 628 | 664 | 763 | 735 | 823 | 1,033 | 1,109 | 1,240 |
| 2014 | 1,393 | 1,142 | 944 | 715 | 500 | 646 | 626 | 714 | 803 | 844 | 1,049 | 1,077 |
| 2015 | 1,281 | 1,305 | 977 | 673 | 599 | 744 | 693 | 720 | 678 | 796 | 858 | 1,079 |
| 2016 | 1,245 | 1,226 | 907 | 659 | 666 | 528 | 640 | 646 | 749 | 795 | 861 | 1,084 |
| 2017 | 1,320 | 935 | 892 | 737 | 548 | 544 | 637 | 604 | 802 | 618 | 956 | 1,048 |
| 2018 | 1,461 | 1,207 | 1,049 | 879 | 524 | 488 | 648 | 625 | 771 | 838 | 1,047 | 1,137 |
| 2019 | 1,372 | 1,237 | 963 | 657 | 558 | 525 | 591 | 541 | 761 | 895 | 1,169 | 1,172 |
| 2020 | 1,181 | 1,257 | 992 | 666 | 625 | 437 | 477 | 591 | 758 | 823 | 972 | 1,122 |
| 2021 | 1,271 | 1,102 | 957 | 614 | 646 | 582 | 631 | 601 | 713 | 825 | 873 | 1,141 |
| 2022 | 1,294 | 1,239 | 941 | 681 | 540 | 565 | 613 | 563 | 746 | 758 | 986 | 1,104 |
| 2023 | 1,095 | 1,046 | 806 | 692 | 520 | 636 | 569 | 655 | 636 | 893 | 957 | 988 |
| 2024 | 1,285 | 1,005 | ||||||||||
| - = No Data Reported; -- = Not Applicable; NA = Not Available; W = Withheld to avoid disclosure of individual company data. |
| Release Date: 4/30/2024 |
| Next Release Date: 5/31/2024 |