|
Download Data (XLS File) |
|
|||||
|
|||||
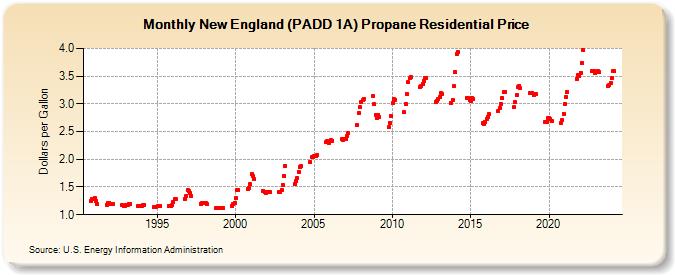
| New England (PADD 1A) Propane Residential Price (Dollars per Gallon) | |||||
| Year | Jan | Feb | Mar | Apr | May | Jun | Jul | Aug | Sep | Oct | Nov | Dec |
|---|---|---|---|---|---|---|---|---|---|---|---|---|
| 1990 | 1.251 | 1.290 | 1.291 | |||||||||
| 1991 | 1.300 | 1.253 | 1.189 | 1.184 | 1.212 | 1.216 | ||||||
| 1992 | 1.202 | 1.195 | 1.185 | 1.169 | 1.166 | 1.164 | ||||||
| 1993 | 1.174 | 1.183 | 1.193 | 1.195 | 1.156 | 1.157 | 1.160 | |||||
| 1994 | 1.163 | 1.182 | 1.183 | 1.137 | 1.136 | 1.147 | ||||||
| 1995 | 1.155 | 1.159 | 1.166 | 1.157 | 1.160 | 1.169 | ||||||
| 1996 | 1.233 | 1.277 | 1.292 | 1.291 | 1.342 | 1.449 | ||||||
| 1997 | 1.429 | 1.388 | 1.337 | 1.199 | 1.212 | 1.213 | ||||||
| 1998 | 1.214 | 1.203 | 1.188 | 1.127 | 1.121 | 1.119 | ||||||
| 1999 | 1.116 | 1.117 | 1.119 | 1.165 | 1.195 | 1.217 | ||||||
| 2000 | 1.298 | 1.452 | 1.445 | 1.472 | 1.489 | 1.553 | ||||||
| 2001 | 1.730 | 1.697 | 1.640 | 1.436 | 1.415 | 1.393 | ||||||
| 2002 | 1.404 | 1.405 | 1.402 | 1.405 | 1.416 | 1.450 | ||||||
| 2003 | 1.536 | 1.703 | 1.880 | 1.560 | 1.605 | 1.662 | ||||||
| 2004 | 1.774 | 1.869 | 1.870 | 1.953 | 2.036 | 2.050 | ||||||
| 2005 | 2.053 | 2.055 | 2.070 | 2.304 | 2.321 | 2.300 | ||||||
| 2006 | 2.332 | 2.342 | 2.337 | 2.363 | 2.349 | 2.360 | ||||||
| 2007 | 2.367 | 2.416 | 2.468 | 2.614 | 2.834 | 2.937 | ||||||
| 2008 | 3.042 | 3.061 | 3.092 | 3.136 | 2.989 | 2.802 | ||||||
| 2009 | 2.742 | 2.807 | 2.763 | 2.577 | 2.660 | 2.781 | ||||||
| 2010 | 3.007 | 3.082 | 3.073 | 2.848 | 2.997 | 3.179 | ||||||
| 2011 | 3.393 | 3.460 | 3.481 | 3.296 | 3.321 | 3.360 | ||||||
| 2012 | 3.419 | 3.460 | 3.473 | 3.037 | 3.055 | 3.079 | ||||||
| 2013 | 3.132 | 3.188 | 3.185 | 3.024 | 3.066 | 3.314 | ||||||
| 2014 | 3.578 | 3.899 | 3.940 | 3.113 | 3.097 | 3.065 | ||||||
| 2015 | 3.059 | 3.104 | 3.091 | 2.650 | 2.630 | 2.671 | ||||||
| 2016 | 2.728 | 2.768 | 2.810 | 2.866 | 2.923 | 3.003 | ||||||
| 2017 | 3.108 | 3.206 | 3.218 | 2.937 | 3.029 | 3.163 | ||||||
| 2018 | 3.299 | 3.327 | 3.278 | 3.195 | 3.201 | 3.202 | ||||||
| 2019 | 3.168 | 3.170 | 3.171 | 2.680 | 2.675 | 2.742 | ||||||
| 2020 | 2.748 | 2.727 | 2.687 | 2.660 | 2.706 | 2.823 | ||||||
| 2021 | 2.998 | 3.126 | 3.212 | 3.454 | 3.520 | 3.506 | ||||||
| 2022 | 3.563 | 3.738 | 3.964 | 3.596 | 3.599 | 3.554 | ||||||
| 2023 | 3.570 | 3.590 | 3.580 | 3.319 | 3.332 | 3.372 | ||||||
| 2024 | 3.466 | 3.599 | 3.584 | |||||||||
| - = No Data Reported; -- = Not Applicable; NA = Not Available; W = Withheld to avoid disclosure of individual company data. |
| Release Date: 4/17/2024 |
| Next Release Date: 4/24/2024 |