|
Download Data (XLS File) |
|
|||||
|
|||||
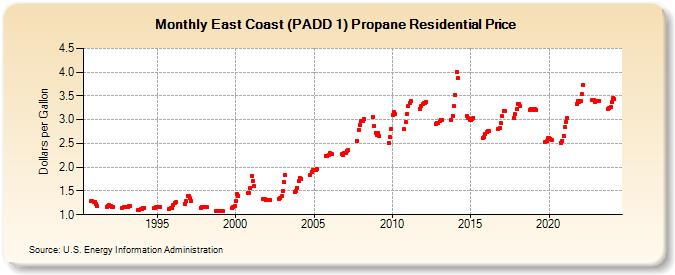
| East Coast (PADD 1) Propane Residential Price (Dollars per Gallon) | |||||
| Year | Jan | Feb | Mar | Apr | May | Jun | Jul | Aug | Sep | Oct | Nov | Dec |
|---|---|---|---|---|---|---|---|---|---|---|---|---|
| 1990 | 1.280 | 1.288 | 1.278 | |||||||||
| 1991 | 1.274 | 1.229 | 1.180 | 1.158 | 1.184 | 1.197 | ||||||
| 1992 | 1.177 | 1.171 | 1.164 | 1.151 | 1.154 | 1.157 | ||||||
| 1993 | 1.167 | 1.169 | 1.181 | 1.177 | 1.102 | 1.105 | 1.110 | |||||
| 1994 | 1.121 | 1.151 | 1.150 | 1.134 | 1.151 | 1.152 | ||||||
| 1995 | 1.163 | 1.169 | 1.164 | 1.129 | 1.132 | 1.146 | ||||||
| 1996 | 1.205 | 1.248 | 1.259 | 1.234 | 1.280 | 1.394 | ||||||
| 1997 | 1.396 | 1.344 | 1.291 | 1.148 | 1.160 | 1.167 | ||||||
| 1998 | 1.171 | 1.164 | 1.154 | 1.072 | 1.070 | 1.070 | ||||||
| 1999 | 1.070 | 1.074 | 1.075 | 1.137 | 1.162 | 1.185 | ||||||
| 2000 | 1.283 | 1.438 | 1.404 | 1.449 | 1.464 | 1.555 | ||||||
| 2001 | 1.820 | 1.703 | 1.600 | 1.331 | 1.322 | 1.300 | ||||||
| 2002 | 1.313 | 1.315 | 1.316 | 1.328 | 1.344 | 1.391 | ||||||
| 2003 | 1.499 | 1.686 | 1.844 | 1.480 | 1.506 | 1.570 | ||||||
| 2004 | 1.706 | 1.772 | 1.747 | 1.834 | 1.903 | 1.940 | ||||||
| 2005 | 1.946 | 1.944 | 1.956 | 2.232 | 2.236 | 2.248 | ||||||
| 2006 | 2.293 | 2.282 | 2.271 | 2.276 | 2.267 | 2.293 | ||||||
| 2007 | 2.301 | 2.336 | 2.364 | 2.558 | 2.788 | 2.885 | ||||||
| 2008 | 2.978 | 2.976 | 3.004 | 3.051 | 2.872 | 2.720 | ||||||
| 2009 | 2.682 | 2.720 | 2.666 | 2.509 | 2.639 | 2.809 | ||||||
| 2010 | 3.106 | 3.159 | 3.113 | 2.795 | 2.942 | 3.120 | ||||||
| 2011 | 3.285 | 3.347 | 3.385 | 3.225 | 3.285 | 3.322 | ||||||
| 2012 | 3.344 | 3.355 | 3.369 | 2.909 | 2.936 | 2.937 | ||||||
| 2013 | 2.963 | 3.001 | 3.002 | 2.995 | 3.087 | 3.291 | ||||||
| 2014 | 3.523 | 4.004 | 3.877 | 3.073 | 3.037 | 2.998 | ||||||
| 2015 | 2.990 | 3.022 | 3.036 | 2.616 | 2.628 | 2.692 | ||||||
| 2016 | 2.731 | 2.762 | 2.757 | 2.811 | 2.824 | 2.926 | ||||||
| 2017 | 3.074 | 3.191 | 3.192 | 3.027 | 3.110 | 3.219 | ||||||
| 2018 | 3.334 | 3.331 | 3.284 | 3.207 | 3.224 | 3.233 | ||||||
| 2019 | 3.208 | 3.215 | 3.198 | 2.533 | 2.544 | 2.608 | ||||||
| 2020 | 2.614 | 2.601 | 2.573 | 2.519 | 2.558 | 2.663 | ||||||
| 2021 | 2.837 | 2.958 | 3.035 | 3.329 | 3.390 | 3.375 | ||||||
| 2022 | 3.399 | 3.547 | 3.729 | 3.406 | 3.404 | 3.376 | ||||||
| 2023 | 3.388 | 3.402 | 3.383 | 3.228 | 3.239 | 3.271 | ||||||
| 2024 | 3.365 | 3.454 | 3.433 | |||||||||
| - = No Data Reported; -- = Not Applicable; NA = Not Available; W = Withheld to avoid disclosure of individual company data. |
| Release Date: 5/1/2024 |
| Next Release Date: 5/8/2024 |