|
Download Data (XLS File) |
|
||||||||
|
||||||||
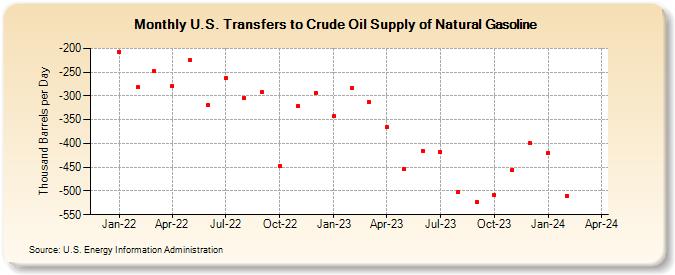
| U.S. Transfers to Crude Oil Supply of Natural Gasoline (Thousand Barrels per Day) | ||||||||
| Year | Jan | Feb | Mar | Apr | May | Jun | Jul | Aug | Sep | Oct | Nov | Dec |
|---|---|---|---|---|---|---|---|---|---|---|---|---|
| 2022 | -207 | -282 | -248 | -279 | -225 | -320 | -263 | -304 | -292 | -448 | -321 | -293 |
| 2023 | -343 | -283 | -312 | -366 | -454 | -415 | -417 | -502 | -523 | -508 | -455 | -400 |
| 2024 | -420 | -510 | ||||||||||
| - = No Data Reported; -- = Not Applicable; NA = Not Available; W = Withheld to avoid disclosure of individual company data. |
| Release Date: 4/30/2024 |
| Next Release Date: 5/31/2024 |
Referring Pages: