|
Download Data (XLS File) |
|
||||||||
|
||||||||
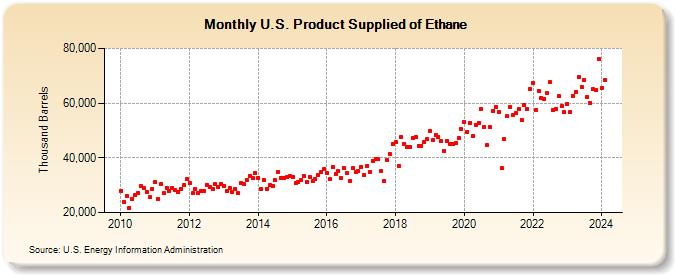
| U.S. Product Supplied of Ethane (Thousand Barrels) | ||||||||
| Year | Jan | Feb | Mar | Apr | May | Jun | Jul | Aug | Sep | Oct | Nov | Dec |
|---|---|---|---|---|---|---|---|---|---|---|---|---|
| 2010 | 27,990 | 23,978 | 26,225 | 21,798 | 25,076 | 26,362 | 27,159 | 29,537 | 28,996 | 27,603 | 25,521 | 28,781 |
| 2011 | 31,101 | 25,100 | 30,316 | 27,056 | 29,145 | 27,791 | 28,968 | 28,206 | 27,576 | 28,752 | 30,047 | 32,138 |
| 2012 | 30,664 | 27,006 | 28,634 | 27,108 | 27,824 | 28,047 | 30,143 | 29,315 | 28,655 | 30,367 | 29,268 | 30,591 |
| 2013 | 29,703 | 27,857 | 28,883 | 27,474 | 28,542 | 27,019 | 30,859 | 30,273 | 32,078 | 33,465 | 32,618 | 34,430 |
| 2014 | 32,802 | 28,566 | 31,926 | 28,767 | 30,151 | 29,613 | 31,721 | 34,914 | 32,673 | 32,751 | 32,918 | 33,297 |
| 2015 | 33,087 | 30,759 | 31,094 | 31,778 | 33,272 | 31,241 | 32,906 | 31,354 | 32,199 | 33,619 | 34,926 | 35,798 |
| 2016 | 34,491 | 32,127 | 36,583 | 34,187 | 35,036 | 32,666 | 36,257 | 34,423 | 31,579 | 36,232 | 34,752 | 35,071 |
| 2017 | 36,645 | 33,772 | 37,147 | 34,972 | 38,856 | 39,752 | 39,439 | 35,042 | 31,401 | 39,309 | 41,278 | 45,103 |
| 2018 | 45,653 | 37,079 | 47,692 | 45,159 | 43,950 | 44,035 | 47,395 | 47,648 | 44,396 | 44,445 | 45,730 | 46,749 |
| 2019 | 49,895 | 46,385 | 48,341 | 47,724 | 46,120 | 42,635 | 46,242 | 45,196 | 45,080 | 45,460 | 47,327 | 50,474 |
| 2020 | 53,045 | 49,594 | 52,913 | 47,877 | 52,132 | 52,700 | 57,784 | 51,180 | 44,634 | 51,124 | 57,264 | 58,490 |
| 2021 | 56,874 | 36,130 | 46,737 | 55,215 | 58,589 | 55,511 | 56,335 | 57,796 | 53,959 | 59,308 | 57,907 | 65,153 |
| 2022 | 67,198 | 57,491 | 64,609 | 61,955 | 61,448 | 63,526 | 67,586 | 57,306 | 57,960 | 62,485 | 58,898 | 56,596 |
| 2023 | 59,592 | 56,795 | 62,583 | 64,095 | 69,627 | 65,818 | 68,303 | 62,247 | 60,083 | 65,052 | 64,857 | 76,231 |
| 2024 | 65,654 | 68,543 | ||||||||||
| - = No Data Reported; -- = Not Applicable; NA = Not Available; W = Withheld to avoid disclosure of individual company data. |
| Release Date: 4/30/2024 |
| Next Release Date: 5/31/2024 |