|
Download Data (XLS File) |
|
||||||||
|
||||||||
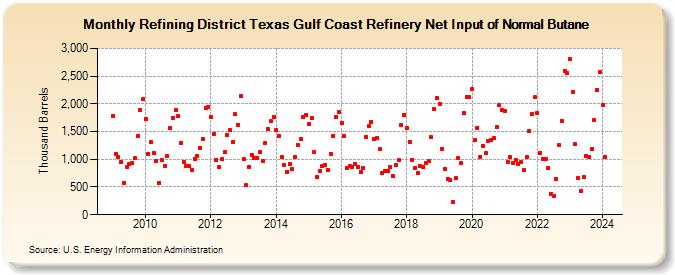
| Refining District Texas Gulf Coast Refinery Net Input of Normal Butane (Thousand Barrels) | ||||||||
| Year | Jan | Feb | Mar | Apr | May | Jun | Jul | Aug | Sep | Oct | Nov | Dec |
|---|---|---|---|---|---|---|---|---|---|---|---|---|
| 2009 | 1,775 | 1,096 | 1,041 | 948 | 578 | 867 | 916 | 936 | 1,018 | 1,419 | 1,887 | 2,081 |
| 2010 | 1,724 | 1,104 | 1,304 | 1,114 | 976 | 578 | 985 | 886 | 1,059 | 1,573 | 1,741 | 1,886 |
| 2011 | 1,783 | 1,294 | 955 | 887 | 883 | 813 | 1,011 | 1,060 | 1,209 | 1,369 | 1,930 | 1,949 |
| 2012 | 1,755 | 1,457 | 995 | 861 | 1,000 | 1,129 | 1,446 | 1,527 | 1,310 | 1,809 | 1,622 | 2,141 |
| 2013 | 999 | 529 | 862 | 1,086 | 1,027 | 1,020 | 1,129 | 973 | 1,291 | 1,542 | 1,683 | 1,771 |
| 2014 | 1,519 | 1,417 | 1,042 | 897 | 778 | 907 | 833 | 1,041 | 1,261 | 1,363 | 1,763 | 1,805 |
| 2015 | 1,638 | 1,738 | 1,134 | 683 | 795 | 878 | 889 | 804 | 1,101 | 1,420 | 1,771 | 1,844 |
| 2016 | 1,657 | 1,417 | 848 | 885 | 868 | 923 | 859 | 770 | 838 | 1,410 | 1,592 | 1,681 |
| 2017 | 1,358 | 1,376 | 1,183 | 758 | 795 | 787 | 859 | 693 | 896 | 986 | 1,622 | 1,801 |
| 2018 | 1,564 | 1,317 | 993 | 838 | 751 | 875 | 863 | 934 | 972 | 1,395 | 1,904 | 2,101 |
| 2019 | 1,995 | 1,186 | 818 | 643 | 632 | 229 | 660 | 1,016 | 931 | 1,838 | 2,126 | 2,123 |
| 2020 | 2,261 | 1,355 | 1,568 | 1,050 | 1,243 | 1,108 | 1,331 | 1,342 | 1,380 | 1,580 | 1,970 | 1,891 |
| 2021 | 1,869 | 945 | 1,044 | 939 | 981 | 921 | 942 | 801 | 1,037 | 1,503 | 1,820 | 2,115 |
| 2022 | 1,837 | 1,122 | 1,013 | 1,003 | 842 | 378 | 332 | 650 | 1,250 | 1,698 | 2,599 | 2,556 |
| 2023 | 2,813 | 2,219 | 1,273 | 665 | 429 | 675 | 1,061 | 1,050 | 1,184 | 1,705 | 2,247 | 2,569 |
| 2024 | 1,985 | 1,038 | ||||||||||
| - = No Data Reported; -- = Not Applicable; NA = Not Available; W = Withheld to avoid disclosure of individual company data. |
| Release Date: 4/30/2024 |
| Next Release Date: 5/31/2024 |
Referring Pages: