|
Download Data (XLS File) |
|
||||||||
|
||||||||
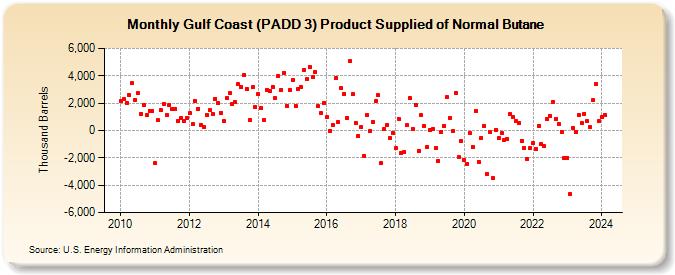
| Gulf Coast (PADD 3) Product Supplied of Normal Butane (Thousand Barrels) | ||||||||
| Year | Jan | Feb | Mar | Apr | May | Jun | Jul | Aug | Sep | Oct | Nov | Dec |
|---|---|---|---|---|---|---|---|---|---|---|---|---|
| 2010 | 2,187 | 2,290 | 2,022 | 2,570 | 3,438 | 2,236 | 2,717 | 1,232 | 1,874 | 1,146 | 1,456 | 1,455 |
| 2011 | -2,407 | 740 | 1,475 | 1,941 | 1,134 | 1,866 | 1,605 | 1,571 | 671 | 933 | 692 | 925 |
| 2012 | 1,243 | 451 | 2,149 | 1,588 | 427 | 218 | 1,155 | 1,465 | 1,222 | 2,325 | 2,024 | 1,279 |
| 2013 | 657 | 2,386 | 2,704 | 1,954 | 2,075 | 3,374 | 3,195 | 4,078 | 3,036 | 770 | 3,154 | 1,731 |
| 2014 | 2,630 | 1,652 | 786 | 2,993 | 2,852 | 3,200 | 2,353 | 3,981 | 2,994 | 4,222 | 1,790 | 2,952 |
| 2015 | 3,674 | 1,797 | 3,063 | 3,194 | 4,445 | 3,736 | 4,665 | 3,894 | 4,266 | 1,762 | 1,277 | 2,007 |
| 2016 | 961 | -34 | 406 | 3,825 | 603 | 3,096 | 2,687 | 897 | 5,055 | 2,633 | 534 | -420 |
| 2017 | 258 | -1,860 | 1,114 | -45 | 613 | 2,129 | 2,573 | -2,393 | 140 | 424 | -561 | -164 |
| 2018 | -1,291 | 875 | -1,648 | -1,557 | 369 | 2,372 | 113 | 1,865 | -1,493 | 1,095 | 322 | -1,201 |
| 2019 | 27 | 142 | -1,268 | -2,214 | -78 | 349 | 2,423 | 948 | -8 | 2,758 | -1,950 | -778 |
| 2020 | -2,194 | -2,435 | -192 | -1,191 | 1,446 | -2,298 | -533 | 334 | -3,181 | -133 | -3,508 | 57 |
| 2021 | -570 | -191 | -679 | -590 | 1,200 | 1,018 | 684 | 573 | -748 | -1,284 | -2,121 | -1,317 |
| 2022 | -926 | -1,321 | 363 | -995 | -1,151 | 804 | 1,079 | 2,099 | 869 | 439 | -128 | -2,026 |
| 2023 | -2,005 | -4,655 | 195 | -146 | 1,137 | 516 | 1,227 | 691 | 229 | 2,197 | 3,368 | 682 |
| 2024 | 980 | 1,136 | ||||||||||
| - = No Data Reported; -- = Not Applicable; NA = Not Available; W = Withheld to avoid disclosure of individual company data. |
| Release Date: 4/30/2024 |
| Next Release Date: 5/31/2024 |