|
Download Data (XLS File) |
|
||||||||
|
||||||||
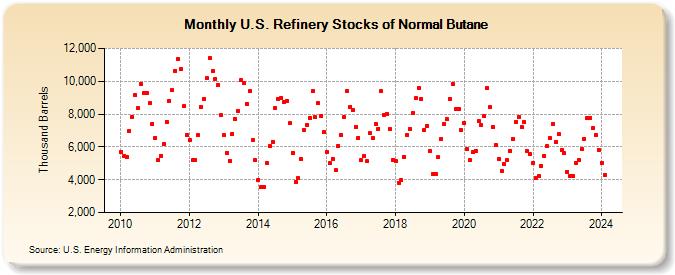
| U.S. Refinery Stocks of Normal Butane (Thousand Barrels) | ||||||||
| Year | Jan | Feb | Mar | Apr | May | Jun | Jul | Aug | Sep | Oct | Nov | Dec |
|---|---|---|---|---|---|---|---|---|---|---|---|---|
| 2010 | 5,695 | 5,457 | 5,408 | 6,970 | 7,850 | 9,138 | 8,347 | 9,849 | 9,257 | 9,293 | 8,678 | 7,417 |
| 2011 | 6,572 | 5,211 | 5,468 | 6,180 | 7,537 | 8,783 | 9,449 | 10,643 | 11,359 | 10,722 | 8,465 | 6,739 |
| 2012 | 6,391 | 5,198 | 5,223 | 6,704 | 8,451 | 8,940 | 10,184 | 11,417 | 10,635 | 10,159 | 9,780 | 7,926 |
| 2013 | 6,702 | 5,658 | 5,155 | 6,808 | 7,708 | 8,208 | 10,049 | 9,878 | 8,641 | 9,393 | 6,393 | 5,198 |
| 2014 | 4,012 | 3,579 | 3,540 | 5,033 | 6,046 | 6,323 | 8,382 | 8,937 | 9,001 | 8,757 | 8,801 | 7,433 |
| 2015 | 5,656 | 3,876 | 4,098 | 5,264 | 7,034 | 7,355 | 7,786 | 9,382 | 7,797 | 8,647 | 7,893 | 6,900 |
| 2016 | 5,664 | 5,003 | 5,281 | 4,587 | 6,074 | 6,732 | 7,813 | 9,432 | 8,454 | 8,238 | 7,239 | 6,559 |
| 2017 | 5,202 | 5,456 | 5,116 | 6,823 | 6,515 | 7,380 | 7,115 | 9,376 | 7,949 | 8,007 | 7,081 | 5,219 |
| 2018 | 5,125 | 3,831 | 3,973 | 5,404 | 6,731 | 7,119 | 8,070 | 8,965 | 9,589 | 8,945 | 7,055 | 7,288 |
| 2019 | 5,737 | 4,355 | 4,368 | 5,365 | 6,494 | 7,415 | 7,677 | 8,944 | 9,834 | 8,312 | 8,312 | 7,008 |
| 2020 | 7,466 | 5,885 | 5,191 | 5,688 | 5,775 | 7,571 | 7,338 | 7,892 | 9,612 | 8,428 | 7,210 | 6,125 |
| 2021 | 5,278 | 4,561 | 4,951 | 5,178 | 5,767 | 6,503 | 7,501 | 7,819 | 7,218 | 7,497 | 5,748 | 5,559 |
| 2022 | 5,008 | 4,129 | 4,209 | 4,854 | 5,439 | 6,031 | 6,531 | 7,409 | 6,299 | 6,775 | 5,823 | 5,603 |
| 2023 | 4,496 | 4,199 | 4,206 | 5,034 | 5,178 | 5,857 | 6,481 | 7,731 | 7,782 | 7,146 | 6,737 | 5,833 |
| 2024 | 5,042 | |||||||||||
| - = No Data Reported; -- = Not Applicable; NA = Not Available; W = Withheld to avoid disclosure of individual company data. |
| Release Date: 3/29/2024 |
| Next Release Date: 4/30/2024 |