|
Download Data (XLS File) |
|
||||||||
|
||||||||
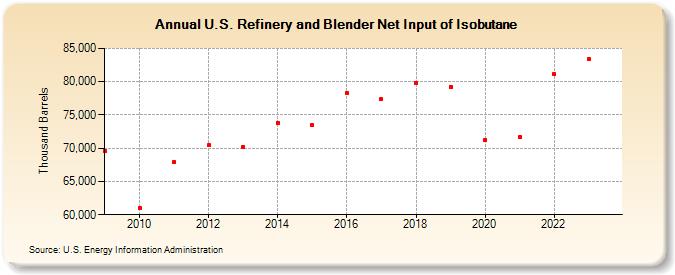
| U.S. Refinery and Blender Net Input of Isobutane (Thousand Barrels) | ||||||||
| Decade | Year-0 | Year-1 | Year-2 | Year-3 | Year-4 | Year-5 | Year-6 | Year-7 | Year-8 | Year-9 |
|---|---|---|---|---|---|---|---|---|---|---|
| 2000's | 69,585 | |||||||||
| 2010's | 60,991 | 67,928 | 70,428 | 70,194 | 73,825 | 73,444 | 78,310 | 77,360 | 79,867 | 79,261 |
| 2020's | 71,249 | 71,671 | 81,118 | 83,410 |
| - = No Data Reported; -- = Not Applicable; NA = Not Available; W = Withheld to avoid disclosure of individual company data. |
| Release Date: 4/30/2024 |
| Next Release Date: 8/30/2024 |