|
Download Data (XLS File) |
|
||||||||
|
||||||||
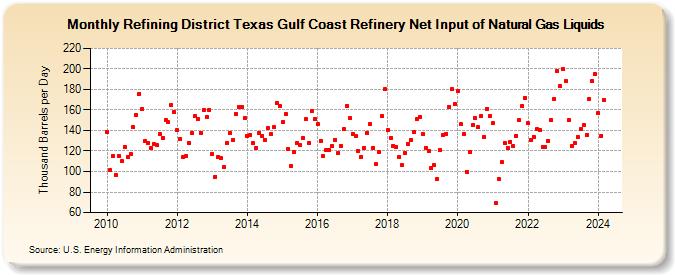
| Refining District Texas Gulf Coast Refinery Net Input of Natural Gas Liquids (Thousand Barrels per Day) | ||||||||
| Year | Jan | Feb | Mar | Apr | May | Jun | Jul | Aug | Sep | Oct | Nov | Dec |
|---|---|---|---|---|---|---|---|---|---|---|---|---|
| 2010 | 139 | 101 | 115 | 97 | 115 | 110 | 124 | 114 | 117 | 143 | 155 | 176 |
| 2011 | 161 | 130 | 128 | 123 | 127 | 126 | 137 | 133 | 150 | 148 | 165 | 158 |
| 2012 | 140 | 132 | 114 | 115 | 128 | 138 | 154 | 151 | 138 | 160 | 153 | 160 |
| 2013 | 117 | 95 | 114 | 113 | 104 | 128 | 138 | 131 | 156 | 163 | 163 | 152 |
| 2014 | 135 | 136 | 128 | 123 | 138 | 135 | 131 | 142 | 137 | 143 | 167 | 164 |
| 2015 | 148 | 156 | 122 | 105 | 119 | 128 | 126 | 133 | 151 | 128 | 159 | 151 |
| 2016 | 146 | 130 | 115 | 121 | 121 | 125 | 131 | 118 | 125 | 141 | 164 | 152 |
| 2017 | 137 | 135 | 120 | 114 | 123 | 138 | 146 | 123 | 107 | 119 | 154 | 180 |
| 2018 | 140 | 133 | 125 | 124 | 114 | 106 | 118 | 127 | 131 | 139 | 151 | 153 |
| 2019 | 137 | 123 | 120 | 103 | 106 | 93 | 121 | 136 | 137 | 163 | 180 | 166 |
| 2020 | 178 | 146 | 137 | 100 | 119 | 145 | 152 | 143 | 154 | 134 | 161 | 154 |
| 2021 | 147 | 69 | 93 | 109 | 128 | 123 | 129 | 125 | 135 | 150 | 164 | 172 |
| 2022 | 147 | 131 | 134 | 141 | 140 | 124 | 124 | 130 | 150 | 171 | 198 | 183 |
| 2023 | 200 | 188 | 150 | 125 | 128 | 134 | 141 | 145 | 136 | 171 | 188 | 195 |
| 2024 | 157 | 135 | ||||||||||
| - = No Data Reported; -- = Not Applicable; NA = Not Available; W = Withheld to avoid disclosure of individual company data. |
| Release Date: 4/30/2024 |
| Next Release Date: 5/31/2024 |