|
Download Data (XLS File) |
|
||||||||
|
||||||||
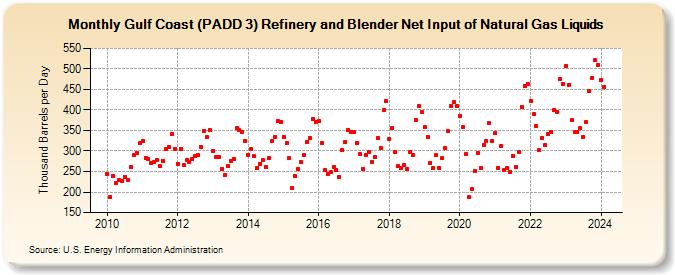
| Gulf Coast (PADD 3) Refinery and Blender Net Input of Natural Gas Liquids (Thousand Barrels per Day) | ||||||||
| Year | Jan | Feb | Mar | Apr | May | Jun | Jul | Aug | Sep | Oct | Nov | Dec |
|---|---|---|---|---|---|---|---|---|---|---|---|---|
| 2010 | 245 | 188 | 240 | 222 | 229 | 227 | 237 | 230 | 262 | 291 | 295 | 319 |
| 2011 | 325 | 284 | 281 | 270 | 272 | 279 | 263 | 276 | 304 | 309 | 342 | 306 |
| 2012 | 269 | 306 | 265 | 277 | 274 | 280 | 287 | 290 | 309 | 349 | 334 | 350 |
| 2013 | 301 | 285 | 285 | 257 | 241 | 264 | 276 | 281 | 355 | 350 | 347 | 325 |
| 2014 | 291 | 305 | 287 | 259 | 269 | 277 | 262 | 282 | 324 | 333 | 372 | 371 |
| 2015 | 334 | 319 | 283 | 211 | 239 | 257 | 273 | 290 | 322 | 332 | 378 | 370 |
| 2016 | 372 | 320 | 253 | 245 | 248 | 262 | 254 | 237 | 302 | 323 | 350 | 346 |
| 2017 | 347 | 319 | 293 | 256 | 291 | 298 | 272 | 286 | 332 | 308 | 400 | 421 |
| 2018 | 329 | 357 | 297 | 263 | 259 | 267 | 256 | 297 | 291 | 376 | 410 | 396 |
| 2019 | 358 | 334 | 271 | 258 | 290 | 258 | 282 | 307 | 348 | 410 | 419 | 410 |
| 2020 | 386 | 359 | 292 | 187 | 208 | 252 | 295 | 258 | 314 | 325 | 367 | 324 |
| 2021 | 343 | 259 | 311 | 253 | 258 | 249 | 288 | 262 | 297 | 408 | 459 | 464 |
| 2022 | 422 | 389 | 360 | 302 | 332 | 315 | 342 | 346 | 401 | 396 | 475 | 464 |
| 2023 | 508 | 462 | 375 | 347 | 347 | 355 | 333 | 370 | 446 | 479 | 521 | 510 |
| 2024 | 473 | 456 | ||||||||||
| - = No Data Reported; -- = Not Applicable; NA = Not Available; W = Withheld to avoid disclosure of individual company data. |
| Release Date: 4/30/2024 |
| Next Release Date: 5/31/2024 |