|
Download Data (XLS File) |
|
||||||||
|
||||||||
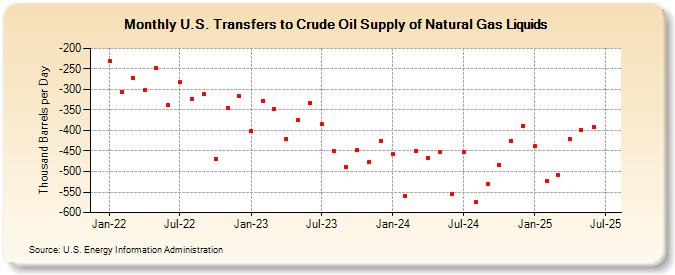
| U.S. Transfers to Crude Oil Supply of Natural Gas Liquids (Thousand Barrels per Day) | ||||||||
| Year | Jan | Feb | Mar | Apr | May | Jun | Jul | Aug | Sep | Oct | Nov | Dec |
|---|---|---|---|---|---|---|---|---|---|---|---|---|
| 2022 | -231 | -306 | -271 | -302 | -247 | -338 | -283 | -323 | -312 | -469 | -345 | -317 |
| 2023 | -367 | -306 | -334 | -388 | -475 | -435 | -434 | -516 | -538 | -528 | -475 | -423 |
| 2024 | -443 | -533 | ||||||||||
| - = No Data Reported; -- = Not Applicable; NA = Not Available; W = Withheld to avoid disclosure of individual company data. |
| Release Date: 4/30/2024 |
| Next Release Date: 5/31/2024 |
Referring Pages: