|
Download Data (XLS File) |
|
||||||||
|
||||||||
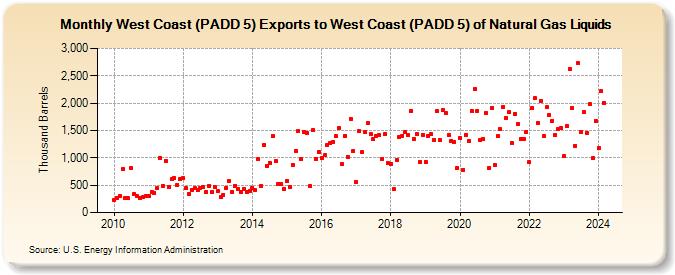
| West Coast (PADD 5) Exports to West Coast (PADD 5) of Natural Gas Liquids (Thousand Barrels) | ||||||||
| Year | Jan | Feb | Mar | Apr | May | Jun | Jul | Aug | Sep | Oct | Nov | Dec |
|---|---|---|---|---|---|---|---|---|---|---|---|---|
| 2010 | 234 | 274 | 306 | 788 | 273 | 259 | 807 | 337 | 299 | 262 | 277 | 299 |
| 2011 | 303 | 372 | 363 | 452 | 1,004 | 494 | 943 | 470 | 606 | 630 | 504 | 621 |
| 2012 | 629 | 448 | 340 | 418 | 444 | 411 | 453 | 462 | 378 | 492 | 379 | 465 |
| 2013 | 386 | 291 | 330 | 449 | 571 | 376 | 491 | 432 | 371 | 431 | 377 | 403 |
| 2014 | 456 | 407 | 971 | 479 | 1,237 | 854 | 914 | 1,402 | 939 | 525 | 519 | 428 |
| 2015 | 579 | 474 | 877 | 1,123 | 1,483 | 980 | 1,476 | 1,449 | 481 | 1,507 | 982 | 1,108 |
| 2016 | 1,001 | 1,047 | 1,226 | 1,262 | 1,296 | 1,391 | 1,540 | 891 | 1,408 | 1,020 | 1,715 | 1,128 |
| 2017 | 558 | 1,488 | 1,106 | 1,467 | 1,628 | 1,436 | 1,336 | 1,407 | 1,413 | 984 | 1,432 | 901 |
| 2018 | 893 | 435 | 967 | 1,386 | 1,405 | 1,463 | 1,420 | 1,857 | 1,348 | 1,441 | 923 | 1,425 |
| 2019 | 932 | 1,407 | 1,428 | 1,323 | 1,850 | 1,329 | 1,869 | 1,820 | 1,420 | 1,309 | 1,297 | 815 |
| 2020 | 1,365 | 786 | 1,426 | 1,313 | 1,862 | 2,255 | 1,861 | 1,321 | 1,353 | 1,821 | 818 | 1,915 |
| 2021 | 872 | 1,400 | 1,523 | 1,935 | 1,735 | 1,831 | 1,266 | 1,807 | 1,619 | 1,350 | 1,340 | 1,478 |
| 2022 | 919 | 1,912 | 2,087 | 1,641 | 2,043 | 1,397 | 1,923 | 1,782 | 1,679 | 1,418 | 1,519 | 1,551 |
| 2023 | 1,026 | 1,585 | 2,623 | 1,905 | 1,225 | 2,728 | 1,480 | 1,839 | 1,461 | 1,978 | 991 | 1,674 |
| 2024 | 1,173 | 2,213 | ||||||||||
| - = No Data Reported; -- = Not Applicable; NA = Not Available; W = Withheld to avoid disclosure of individual company data. |
| Release Date: 4/30/2024 |
| Next Release Date: 5/31/2024 |