|
Download Data (XLS File) |
|
||||||||
|
||||||||
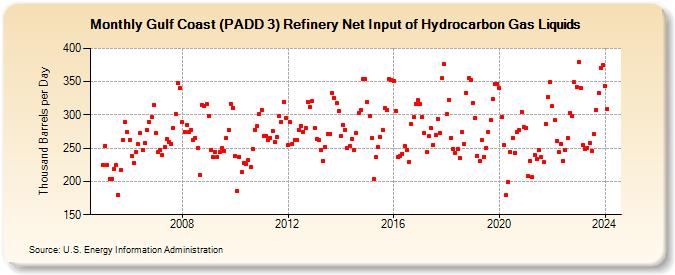
| Gulf Coast (PADD 3) Refinery Net Input of Hydrocarbon Gas Liquids (Thousand Barrels per Day) | ||||||||
| Year | Jan | Feb | Mar | Apr | May | Jun | Jul | Aug | Sep | Oct | Nov | Dec |
|---|---|---|---|---|---|---|---|---|---|---|---|---|
| 2005 | 225 | 254 | 225 | 204 | 204 | 219 | 224 | 180 | 217 | 263 | 289 | 275 |
| 2006 | 263 | 239 | 228 | 245 | 256 | 273 | 248 | 258 | 278 | 290 | 297 | 315 |
| 2007 | 273 | 244 | 248 | 240 | 252 | 264 | 259 | 256 | 281 | 302 | 348 | 340 |
| 2008 | 289 | 275 | 285 | 274 | 278 | 262 | 266 | 251 | 209 | 315 | 313 | 316 |
| 2009 | 299 | 248 | 236 | 245 | 236 | 244 | 251 | 246 | 266 | 277 | 317 | 311 |
| 2010 | 239 | 186 | 237 | 214 | 228 | 226 | 232 | 221 | 249 | 278 | 283 | 302 |
| 2011 | 308 | 269 | 269 | 263 | 266 | 276 | 259 | 267 | 298 | 290 | 320 | 295 |
| 2012 | 255 | 289 | 257 | 263 | 263 | 277 | 284 | 275 | 280 | 320 | 312 | 321 |
| 2013 | 281 | 264 | 262 | 247 | 231 | 252 | 271 | 271 | 333 | 326 | 318 | 306 |
| 2014 | 269 | 285 | 278 | 250 | 253 | 264 | 248 | 273 | 303 | 307 | 354 | 354 |
| 2015 | 320 | 298 | 265 | 204 | 236 | 252 | 267 | 277 | 310 | 307 | 354 | 353 |
| 2016 | 351 | 306 | 236 | 239 | 242 | 253 | 247 | 229 | 286 | 297 | 317 | 322 |
| 2017 | 316 | 297 | 273 | 244 | 268 | 280 | 255 | 270 | 294 | 273 | 355 | 376 |
| 2018 | 301 | 323 | 266 | 249 | 243 | 249 | 235 | 274 | 256 | 333 | 355 | 353 |
| 2019 | 318 | 296 | 239 | 231 | 263 | 236 | 251 | 274 | 292 | 324 | 346 | 347 |
| 2020 | 340 | 297 | 255 | 179 | 199 | 244 | 266 | 243 | 274 | 277 | 305 | 282 |
| 2021 | 280 | 208 | 231 | 206 | 240 | 233 | 247 | 236 | 229 | 287 | 327 | 350 |
| 2022 | 313 | 292 | 261 | 244 | 257 | 231 | 248 | 266 | 303 | 298 | 349 | 342 |
| 2023 | 379 | 340 | 255 | 249 | 251 | 258 | 246 | 271 | 308 | 333 | 371 | 375 |
| 2024 | 343 | 309 | ||||||||||
| - = No Data Reported; -- = Not Applicable; NA = Not Available; W = Withheld to avoid disclosure of individual company data. |
| Release Date: 4/30/2024 |
| Next Release Date: 5/31/2024 |
Referring Pages: