|
Download Data (XLS File) |
|
||||||||
|
||||||||
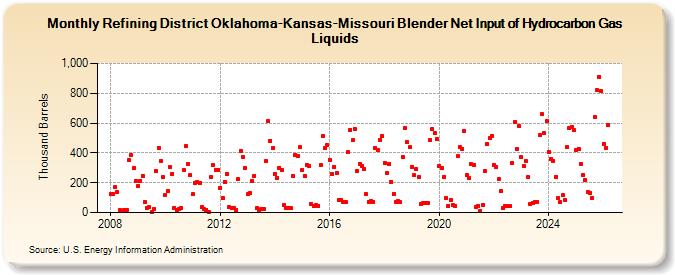
| Refining District Oklahoma-Kansas-Missouri Blender Net Input of Hydrocarbon Gas Liquids (Thousand Barrels) | ||||||||
| Year | Jan | Feb | Mar | Apr | May | Jun | Jul | Aug | Sep | Oct | Nov | Dec |
|---|---|---|---|---|---|---|---|---|---|---|---|---|
| 2008 | 124 | 122 | 171 | 136 | 16 | 9 | 18 | 20 | 353 | 383 | 297 | 215 |
| 2009 | 178 | 214 | 246 | 72 | 32 | 35 | 1 | 24 | 280 | 436 | 346 | 237 |
| 2010 | 117 | 142 | 304 | 262 | 31 | 17 | 25 | 29 | 287 | 448 | 324 | 251 |
| 2011 | 122 | 199 | 206 | 199 | 37 | 23 | 19 | 4 | 239 | 317 | 288 | 287 |
| 2012 | 168 | 95 | 207 | 261 | 37 | 31 | 28 | 19 | 222 | 416 | 376 | 301 |
| 2013 | 124 | 129 | 215 | 247 | 28 | 19 | 23 | 24 | 345 | 611 | 483 | 434 |
| 2014 | 259 | 234 | 302 | 284 | 52 | 31 | 33 | 30 | 248 | 389 | 379 | 438 |
| 2015 | 287 | 246 | 321 | 311 | 58 | 45 | 49 | 46 | 318 | 512 | 433 | 453 |
| 2016 | 353 | 257 | 308 | 265 | 84 | 85 | 68 | 70 | 403 | 557 | 485 | 561 |
| 2017 | 280 | 325 | 315 | 290 | 123 | 72 | 77 | 73 | 436 | 422 | 486 | 515 |
| 2018 | 331 | 264 | 327 | 208 | 127 | 73 | 77 | 69 | 370 | 567 | 473 | 437 |
| 2019 | 308 | 249 | 291 | 236 | 57 | 63 | 66 | 62 | 484 | 559 | 531 | 495 |
| 2020 | 313 | 302 | 240 | 98 | 45 | 83 | 53 | 45 | 377 | 438 | 429 | 547 |
| 2021 | 250 | 231 | 327 | 320 | 39 | 47 | 9 | 54 | 279 | 460 | 500 | 514 |
| 2022 | 316 | 304 | 223 | 144 | 30 | 45 | 43 | 43 | 332 | 606 | 425 | 579 |
| 2023 | 371 | 310 | 344 | 239 | 60 | 63 | 68 | 71 | 518 | 658 | 533 | 612 |
| 2024 | 409 | |||||||||||
| - = No Data Reported; -- = Not Applicable; NA = Not Available; W = Withheld to avoid disclosure of individual company data. |
| Release Date: 3/29/2024 |
| Next Release Date: 4/30/2024 |