|
Download Data (XLS File) |
|
||||||||
|
||||||||
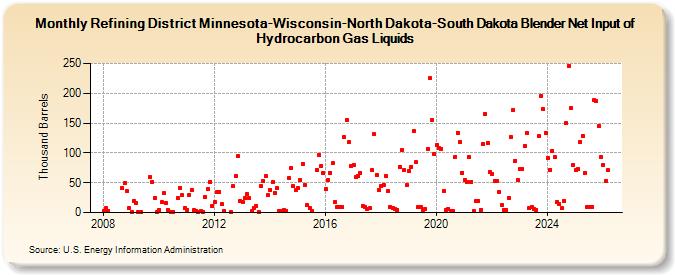
| Refining District Minnesota-Wisconsin-North Dakota-South Dakota Blender Net Input of Hydrocarbon Gas Liquids (Thousand Barrels) | ||||||||
| Year | Jan | Feb | Mar | Apr | May | Jun | Jul | Aug | Sep | Oct | Nov | Dec |
|---|---|---|---|---|---|---|---|---|---|---|---|---|
| 2008 | 3 | 7 | 3 | 41 | 49 | 36 | 7 | |||||
| 2009 | 1 | 20 | 16 | 1 | 1 | 60 | 52 | 24 | 1 | |||
| 2010 | 5 | 17 | 32 | 16 | 4 | 1 | 1 | 25 | 42 | 29 | 8 | |
| 2011 | 5 | 30 | 38 | 4 | 3 | 1 | 2 | 1 | 26 | 40 | 52 | 11 |
| 2012 | 18 | 34 | 35 | 14 | 2 | 1 | 44 | 61 | 95 | 20 | ||
| 2013 | 17 | 24 | 31 | 24 | 2 | 8 | 11 | 1 | 44 | 53 | 61 | 29 |
| 2014 | 38 | 51 | 33 | 41 | 2 | 2 | 4 | 3 | 58 | 75 | 44 | 37 |
| 2015 | 42 | 54 | 82 | 46 | 12 | 8 | 2 | 72 | 97 | 78 | 66 | |
| 2016 | 39 | 54 | 67 | 83 | 18 | 10 | 9 | 10 | 126 | 156 | 118 | 78 |
| 2017 | 80 | 59 | 61 | 67 | 11 | 10 | 6 | 7 | 71 | 131 | 63 | 37 |
| 2018 | 44 | 47 | 62 | 36 | 9 | 7 | 6 | 5 | 77 | 105 | 71 | 46 |
| 2019 | 70 | 77 | 137 | 84 | 9 | 9 | 5 | 6 | 107 | 225 | 155 | 98 |
| 2020 | 114 | 108 | 107 | 36 | 4 | 6 | 2 | 2 | 94 | 134 | 119 | 67 |
| 2021 | 55 | 52 | 94 | 52 | 3 | 20 | 20 | 5 | 115 | 165 | 117 | 68 |
| 2022 | 65 | 53 | 53 | 35 | 12 | 5 | 4 | 25 | 127 | 172 | 87 | 54 |
| 2023 | 73 | 73 | 112 | 133 | 7 | 9 | 6 | 5 | 128 | 196 | 173 | 133 |
| 2024 | 92 | 72 | ||||||||||
| - = No Data Reported; -- = Not Applicable; NA = Not Available; W = Withheld to avoid disclosure of individual company data. |
| Release Date: 4/30/2024 |
| Next Release Date: 5/31/2024 |