|
Download Data (XLS File) |
|
||||||||
|
||||||||
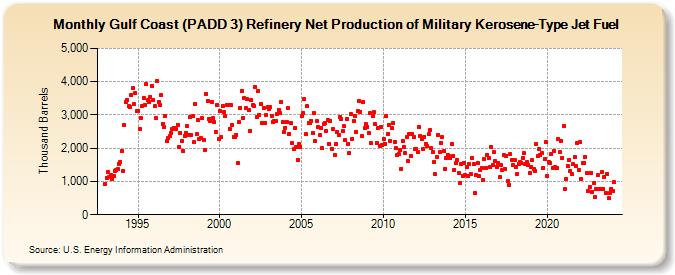
| Gulf Coast (PADD 3) Refinery Net Production of Military Kerosene-Type Jet Fuel (Thousand Barrels) | ||||||||
| Year | Jan | Feb | Mar | Apr | May | Jun | Jul | Aug | Sep | Oct | Nov | Dec |
|---|---|---|---|---|---|---|---|---|---|---|---|---|
| 1993 | 925 | 1,104 | 1,289 | 1,148 | 1,181 | 1,088 | 1,154 | 1,321 | 1,336 | 1,381 | 1,534 | 1,589 |
| 1994 | 1,924 | 1,311 | 2,690 | 3,386 | 3,447 | 3,255 | 3,245 | 3,600 | 3,804 | 3,320 | 3,655 | 3,123 |
| 1995 | 3,113 | 2,581 | 2,920 | 3,275 | 3,523 | 3,311 | 3,927 | 3,442 | 3,378 | 3,545 | 3,883 | 3,456 |
| 1996 | 3,264 | 2,898 | 4,006 | 3,399 | 3,312 | 3,594 | 2,728 | 2,642 | 2,975 | 2,207 | 2,315 | 2,362 |
| 1997 | 2,450 | 2,571 | 2,609 | 2,618 | 2,583 | 2,709 | 2,037 | 2,455 | 2,218 | 1,916 | 2,381 | 2,458 |
| 1998 | 2,659 | 2,404 | 2,925 | 2,410 | 2,965 | 2,183 | 3,325 | 2,441 | 2,853 | 2,264 | 2,315 | 2,893 |
| 1999 | 2,241 | 1,943 | 3,643 | 3,429 | 2,875 | 2,825 | 3,391 | 2,894 | 2,786 | 2,495 | 3,313 | 2,272 |
| 2000 | 3,126 | 2,337 | 3,273 | 3,087 | 2,977 | 3,286 | 3,300 | 2,582 | 3,284 | 2,694 | 2,349 | 2,344 |
| 2001 | 2,411 | 1,559 | 2,776 | 3,209 | 3,723 | 2,895 | 3,496 | 3,195 | 3,467 | 3,148 | 2,527 | 3,440 |
| 2002 | 3,286 | 3,271 | 3,843 | 2,923 | 3,723 | 2,999 | 3,327 | 2,760 | 3,199 | 2,759 | 3,002 | 3,231 |
| 2003 | 3,167 | 3,225 | 2,976 | 2,797 | 2,803 | 2,824 | 3,031 | 3,160 | 3,050 | 3,400 | 2,779 | 2,491 |
| 2004 | 2,615 | 2,794 | 3,194 | 2,427 | 2,757 | 2,145 | 1,961 | 2,621 | 2,033 | 1,659 | 2,119 | 2,048 |
| 2005 | 2,967 | 3,061 | 3,468 | 2,421 | 3,258 | 2,755 | 2,772 | 2,832 | 2,459 | 3,057 | 2,213 | 2,809 |
| 2006 | 2,646 | 2,383 | 2,615 | 2,002 | 2,718 | 2,767 | 2,528 | 2,855 | 2,134 | 2,827 | 1,984 | 2,569 |
| 2007 | 1,797 | 2,137 | 2,486 | 2,407 | 2,946 | 2,871 | 2,522 | 2,657 | 2,232 | 2,884 | 2,124 | 1,858 |
| 2008 | 3,015 | 2,284 | 2,818 | 2,980 | 2,489 | 3,103 | 3,418 | 3,096 | 2,370 | 3,377 | 2,601 | 2,721 |
| 2009 | 2,642 | 2,462 | 3,054 | 2,147 | 2,957 | 3,075 | 2,723 | 2,168 | 2,607 | 2,078 | 2,630 | 2,100 |
| 2010 | 2,281 | 2,137 | 2,957 | 2,430 | 2,696 | 2,221 | 2,595 | 2,745 | 2,181 | 2,005 | 1,794 | 1,828 |
| 2011 | 1,937 | 1,382 | 2,225 | 2,029 | 1,847 | 2,349 | 1,609 | 2,418 | 1,772 | 2,422 | 2,347 | 1,975 |
| 2012 | 1,969 | 1,887 | 2,636 | 2,366 | 2,288 | 1,977 | 2,345 | 2,136 | 2,056 | 2,423 | 2,553 | 1,991 |
| 2013 | 1,893 | 1,581 | 1,209 | 1,735 | 2,410 | 1,883 | 2,170 | 2,327 | 1,903 | 1,389 | 1,706 | 1,793 |
| 2014 | 1,751 | 1,710 | 2,126 | 1,776 | 1,357 | 1,548 | 1,652 | 1,253 | 943 | 1,511 | 1,164 | 1,564 |
| 2015 | 1,180 | 1,445 | 1,174 | 1,523 | 1,226 | 1,710 | 1,512 | 640 | 1,180 | 1,553 | 1,152 | 1,358 |
| 2016 | 1,417 | 1,052 | 1,664 | 1,410 | 1,809 | 1,709 | 1,429 | 2,031 | 1,494 | 1,878 | 1,603 | 1,436 |
| 2017 | 1,558 | 1,120 | 1,484 | 1,339 | 1,806 | 1,377 | 1,777 | 1,006 | 894 | 1,816 | 1,644 | 1,505 |
| 2018 | 1,630 | 1,445 | 1,231 | 1,511 | 1,575 | 1,564 | 1,715 | 1,842 | 1,529 | 1,599 | 1,488 | 1,262 |
| 2019 | 1,433 | 1,633 | 1,379 | 1,313 | 2,119 | 1,764 | 1,979 | 1,781 | 1,865 | 1,405 | 1,672 | 2,183 |
| 2020 | 1,177 | 1,598 | 1,559 | 1,838 | 1,399 | 1,909 | 1,427 | 1,394 | 2,272 | 1,883 | 2,219 | 1,710 |
| 2021 | 2,661 | 762 | 1,068 | 1,473 | 1,652 | 1,314 | 1,211 | 1,518 | 1,724 | 1,463 | 2,165 | 1,344 |
| 2022 | 2,174 | 1,086 | 1,560 | 1,551 | 1,726 | 1,251 | 707 | 838 | 1,263 | 686 | 942 | 530 |
| 2023 | 769 | 1,179 | 765 | 778 | 1,282 | 786 | 1,140 | 663 | 1,237 | 489 | 639 | 782 |
| 2024 | 717 | |||||||||||
| - = No Data Reported; -- = Not Applicable; NA = Not Available; W = Withheld to avoid disclosure of individual company data. |
| Release Date: 3/29/2024 |
| Next Release Date: 4/30/2024 |