|
Download Data (XLS File) |
|
||||||||
|
||||||||
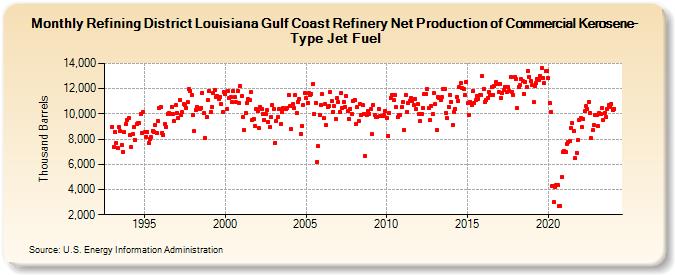
| Refining District Louisiana Gulf Coast Refinery Net Production of Commercial Kerosene-Type Jet Fuel (Thousand Barrels) | ||||||||
| Year | Jan | Feb | Mar | Apr | May | Jun | Jul | Aug | Sep | Oct | Nov | Dec |
|---|---|---|---|---|---|---|---|---|---|---|---|---|
| 1993 | 8,987 | 7,392 | 8,552 | 7,697 | 7,332 | 8,987 | 8,649 | 7,571 | 6,972 | 8,548 | 9,215 | 9,536 |
| 1994 | 9,687 | 8,297 | 7,411 | 8,389 | 8,955 | 7,946 | 9,185 | 9,261 | 9,295 | 9,981 | 8,494 | 10,122 |
| 1995 | 8,549 | 8,187 | 8,583 | 7,661 | 8,041 | 8,134 | 8,675 | 8,565 | 9,104 | 8,479 | 9,458 | 10,449 |
| 1996 | 10,564 | 8,504 | 8,335 | 9,232 | 8,967 | 9,992 | 10,054 | 10,022 | 10,580 | 9,998 | 9,403 | 10,674 |
| 1997 | 10,052 | 9,642 | 11,118 | 9,949 | 10,118 | 10,751 | 10,680 | 10,470 | 10,914 | 11,939 | 11,827 | 11,507 |
| 1998 | 9,947 | 8,604 | 10,318 | 10,557 | 10,407 | 10,399 | 10,496 | 11,697 | 10,033 | 8,093 | 9,746 | 11,098 |
| 1999 | 11,814 | 10,152 | 10,557 | 11,652 | 11,880 | 11,333 | 11,424 | 11,174 | 11,369 | 10,795 | 10,169 | 11,747 |
| 2000 | 11,557 | 10,404 | 11,837 | 11,273 | 11,357 | 10,946 | 11,836 | 11,305 | 10,914 | 11,813 | 10,851 | 12,209 |
| 2001 | 11,385 | 9,719 | 8,714 | 10,063 | 10,845 | 11,172 | 11,109 | 11,705 | 9,530 | 9,628 | 9,037 | 10,407 |
| 2002 | 10,193 | 8,842 | 10,583 | 10,422 | 10,030 | 9,549 | 9,963 | 10,272 | 9,365 | 8,993 | 9,750 | 10,711 |
| 2003 | 10,388 | 7,729 | 9,442 | 9,745 | 10,375 | 9,173 | 10,114 | 10,482 | 10,402 | 10,401 | 10,459 | 11,508 |
| 2004 | 10,599 | 8,802 | 10,761 | 10,456 | 11,492 | 10,087 | 10,966 | 11,209 | 8,400 | 9,070 | 10,725 | 11,648 |
| 2005 | 11,226 | 10,843 | 11,654 | 11,469 | 11,603 | 12,391 | 10,020 | 10,893 | 6,163 | 7,420 | 9,905 | 10,718 |
| 2006 | 11,606 | 9,636 | 10,797 | 9,088 | 10,558 | 10,646 | 11,728 | 11,008 | 10,186 | 10,606 | 9,588 | 11,254 |
| 2007 | 10,940 | 10,148 | 11,674 | 10,434 | 10,964 | 10,569 | 11,399 | 10,221 | 9,558 | 10,413 | 10,031 | 10,991 |
| 2008 | 11,131 | 9,190 | 10,585 | 9,403 | 10,754 | 9,873 | 10,669 | 10,011 | 6,671 | 9,940 | 10,200 | 10,015 |
| 2009 | 10,357 | 8,382 | 10,708 | 9,926 | 9,788 | 9,761 | 10,418 | 9,849 | 9,843 | 9,853 | 9,928 | 10,241 |
| 2010 | 9,645 | 8,265 | 10,103 | 11,280 | 11,530 | 11,073 | 11,494 | 10,546 | 9,718 | 9,946 | 9,937 | 10,546 |
| 2011 | 10,944 | 8,747 | 11,526 | 10,180 | 10,888 | 11,033 | 11,266 | 10,989 | 10,681 | 11,187 | 10,376 | 10,797 |
| 2012 | 9,976 | 9,406 | 10,025 | 10,470 | 11,576 | 11,565 | 11,958 | 10,439 | 9,519 | 10,647 | 9,968 | 11,647 |
| 2013 | 10,765 | 8,707 | 11,342 | 11,223 | 11,071 | 11,306 | 11,993 | 12,009 | 10,094 | 9,711 | 10,577 | 11,533 |
| 2014 | 10,971 | 9,132 | 10,185 | 10,405 | 11,368 | 11,046 | 12,119 | 12,424 | 12,027 | 11,945 | 11,489 | 12,559 |
| 2015 | 10,837 | 9,939 | 10,971 | 10,708 | 11,779 | 10,833 | 11,079 | 11,456 | 11,188 | 11,483 | 11,487 | 12,977 |
| 2016 | 11,997 | 10,966 | 11,110 | 11,226 | 11,774 | 11,523 | 12,131 | 11,537 | 12,175 | 12,499 | 12,403 | 11,745 |
| 2017 | 12,359 | 11,286 | 11,642 | 11,867 | 12,170 | 11,773 | 12,105 | 11,795 | 12,907 | 11,768 | 11,460 | 12,957 |
| 2018 | 12,746 | 10,439 | 12,138 | 12,282 | 12,746 | 12,578 | 11,609 | 12,568 | 12,131 | 13,415 | 12,948 | 12,599 |
| 2019 | 12,253 | 10,919 | 12,235 | 12,432 | 12,745 | 12,708 | 13,035 | 13,676 | 12,857 | 12,423 | 13,392 | 13,439 |
| 2020 | 12,818 | 10,850 | 10,167 | 4,299 | 2,996 | 4,167 | 4,367 | 4,343 | 2,668 | 2,692 | 4,996 | 6,971 |
| 2021 | 7,047 | 6,960 | 7,644 | 7,764 | 7,876 | 8,861 | 9,240 | 8,630 | 6,488 | 6,926 | 7,925 | 9,543 |
| 2022 | 9,677 | 8,946 | 9,558 | 10,214 | 10,602 | 10,388 | 10,949 | 10,092 | 8,052 | 8,691 | 9,111 | 9,878 |
| 2023 | 9,879 | 9,044 | 10,087 | 9,988 | 10,491 | 9,535 | 10,093 | 9,717 | 10,384 | 10,688 | 10,521 | 10,806 |
| 2024 | 10,283 | |||||||||||
| - = No Data Reported; -- = Not Applicable; NA = Not Available; W = Withheld to avoid disclosure of individual company data. |
| Release Date: 3/29/2024 |
| Next Release Date: 4/30/2024 |