|
Download Data (XLS File) |
|
||||||||
|
||||||||
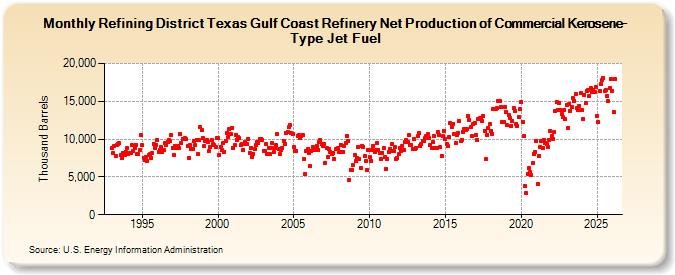
| Refining District Texas Gulf Coast Refinery Net Production of Commercial Kerosene-Type Jet Fuel (Thousand Barrels) | ||||||||
| Year | Jan | Feb | Mar | Apr | May | Jun | Jul | Aug | Sep | Oct | Nov | Dec |
|---|---|---|---|---|---|---|---|---|---|---|---|---|
| 1993 | 8,803 | 8,154 | 9,152 | 7,779 | 9,171 | 9,361 | 9,442 | 7,954 | 7,491 | 8,208 | 7,916 | 8,303 |
| 1994 | 8,857 | 8,090 | 8,184 | 8,219 | 9,193 | 8,427 | 8,866 | 9,264 | 8,068 | 8,016 | 8,548 | 10,498 |
| 1995 | 9,186 | 7,524 | 7,261 | 7,650 | 7,071 | 7,874 | 8,007 | 7,555 | 8,149 | 9,417 | 8,877 | 9,220 |
| 1996 | 9,918 | 8,352 | 8,576 | 8,901 | 8,240 | 8,515 | 9,418 | 9,281 | 9,660 | 9,855 | 9,686 | 10,503 |
| 1997 | 8,887 | 7,944 | 9,038 | 8,872 | 9,068 | 8,769 | 10,692 | 9,433 | 9,987 | 10,003 | 10,082 | 9,954 |
| 1998 | 9,064 | 7,487 | 9,191 | 8,740 | 8,651 | 9,814 | 9,175 | 9,843 | 8,035 | 9,859 | 11,590 | 11,151 |
| 1999 | 10,185 | 9,115 | 9,718 | 9,843 | 9,667 | 8,375 | 8,953 | 9,823 | 9,308 | 9,207 | 8,933 | 10,145 |
| 2000 | 10,094 | 7,957 | 8,970 | 8,526 | 9,442 | 8,340 | 9,722 | 10,863 | 10,223 | 11,271 | 10,737 | 11,449 |
| 2001 | 8,803 | 9,230 | 10,558 | 9,906 | 10,292 | 10,102 | 9,186 | 9,383 | 8,586 | 9,611 | 9,331 | 9,302 |
| 2002 | 10,027 | 8,211 | 8,864 | 7,580 | 8,085 | 8,683 | 9,221 | 9,650 | 9,533 | 9,978 | 10,079 | 9,918 |
| 2003 | 8,451 | 8,419 | 9,299 | 7,992 | 8,847 | 8,077 | 8,864 | 9,470 | 8,241 | 8,821 | 9,186 | 10,623 |
| 2004 | 8,679 | 8,045 | 8,497 | 8,860 | 9,788 | 9,409 | 10,822 | 10,916 | 11,562 | 11,868 | 10,765 | 10,647 |
| 2005 | 8,895 | 8,483 | 8,419 | 10,422 | 10,524 | 10,108 | 10,470 | 10,478 | 7,360 | 5,401 | 8,485 | 8,723 |
| 2006 | 8,197 | 6,378 | 8,384 | 8,890 | 8,497 | 8,535 | 9,119 | 8,600 | 9,646 | 9,937 | 9,293 | 9,124 |
| 2007 | 9,329 | 6,889 | 8,782 | 7,667 | 8,676 | 8,333 | 7,964 | 8,146 | 7,359 | 8,667 | 8,751 | 8,776 |
| 2008 | 8,318 | 9,278 | 8,306 | 8,355 | 9,114 | 9,456 | 10,442 | 9,787 | 4,633 | 5,929 | 5,954 | 6,520 |
| 2009 | 7,850 | 7,099 | 7,503 | 9,008 | 7,379 | 6,160 | 9,134 | 8,959 | 7,730 | 7,104 | 5,935 | 8,623 |
| 2010 | 7,573 | 7,151 | 8,615 | 9,137 | 8,247 | 8,622 | 9,462 | 8,525 | 8,107 | 7,379 | 8,189 | 8,771 |
| 2011 | 7,571 | 6,035 | 7,416 | 8,316 | 8,704 | 8,397 | 9,326 | 8,415 | 8,947 | 7,340 | 7,492 | 7,964 |
| 2012 | 8,837 | 8,422 | 9,103 | 8,554 | 9,654 | 9,906 | 9,563 | 10,514 | 9,238 | 9,233 | 8,687 | 10,042 |
| 2013 | 8,628 | 8,862 | 10,348 | 10,783 | 9,030 | 9,287 | 9,736 | 9,686 | 10,133 | 10,374 | 10,626 | 10,132 |
| 2014 | 9,233 | 8,821 | 9,552 | 10,404 | 8,864 | 8,817 | 10,907 | 10,487 | 8,902 | 7,825 | 10,408 | 11,055 |
| 2015 | 10,016 | 9,312 | 9,053 | 10,216 | 12,072 | 11,632 | 12,046 | 10,737 | 9,472 | 10,580 | 10,871 | 12,333 |
| 2016 | 9,700 | 9,918 | 10,912 | 11,401 | 11,184 | 11,275 | 13,098 | 12,563 | 11,584 | 10,405 | 11,959 | 12,163 |
| 2017 | 10,502 | 9,883 | 12,671 | 12,750 | 12,667 | 12,343 | 13,074 | 11,118 | 7,307 | 10,553 | 11,436 | 11,937 |
| 2018 | 11,131 | 10,726 | 14,037 | 13,953 | 13,958 | 14,051 | 15,012 | 15,039 | 14,204 | 12,227 | 12,317 | 14,267 |
| 2019 | 13,633 | 11,806 | 13,148 | 12,792 | 11,740 | 12,419 | 14,108 | 13,739 | 12,015 | 11,707 | 12,910 | 13,926 |
| 2020 | 14,857 | 12,309 | 10,419 | 3,860 | 2,870 | 5,358 | 6,131 | 5,645 | 5,230 | 6,794 | 8,073 | 8,286 |
| 2021 | 9,744 | 4,089 | 7,744 | 8,945 | 9,752 | 8,874 | 9,912 | 9,490 | 9,370 | 8,987 | 9,922 | 11,121 |
| 2022 | 10,374 | 10,033 | 10,924 | 13,719 | 14,850 | 13,898 | 14,810 | 13,838 | 13,369 | 12,869 | 13,853 | 12,672 |
| 2023 | 14,536 | 11,477 | 14,802 | 13,781 | 14,190 | 15,388 | 15,046 | 15,983 | 14,047 | 13,895 | 14,426 | 16,040 |
| 2024 | 13,837 | |||||||||||
| - = No Data Reported; -- = Not Applicable; NA = Not Available; W = Withheld to avoid disclosure of individual company data. |
| Release Date: 3/29/2024 |
| Next Release Date: 4/30/2024 |