|
Download Data (XLS File) |
|
||||||||
|
||||||||
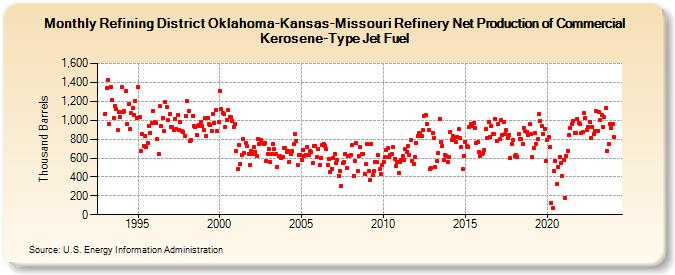
| Refining District Oklahoma-Kansas-Missouri Refinery Net Production of Commercial Kerosene-Type Jet Fuel (Thousand Barrels) | ||||||||
| Year | Jan | Feb | Mar | Apr | May | Jun | Jul | Aug | Sep | Oct | Nov | Dec |
|---|---|---|---|---|---|---|---|---|---|---|---|---|
| 1993 | 1,069 | 1,343 | 1,429 | 961 | 1,352 | 1,211 | 1,025 | 1,153 | 1,115 | 893 | 1,082 | 1,033 |
| 1994 | 1,348 | 1,087 | 1,095 | 1,308 | 964 | 1,167 | 906 | 1,073 | 1,125 | 1,055 | 1,202 | 1,023 |
| 1995 | 1,356 | 1,029 | 670 | 856 | 727 | 836 | 718 | 764 | 934 | 867 | 970 | 1,098 |
| 1996 | 983 | 970 | 798 | 643 | 1,145 | 940 | 1,028 | 882 | 1,191 | 1,140 | 998 | 1,064 |
| 1997 | 928 | 928 | 900 | 1,013 | 908 | 1,056 | 894 | 978 | 883 | 876 | 833 | 1,046 |
| 1998 | 1,199 | 1,099 | 778 | 792 | 1,042 | 936 | 926 | 848 | 935 | 949 | 985 | 942 |
| 1999 | 894 | 1,018 | 832 | 1,019 | 958 | 944 | 886 | 1,063 | 969 | 1,108 | 890 | 976 |
| 2000 | 1,314 | 1,118 | 1,077 | 1,064 | 933 | 1,001 | 1,106 | 1,032 | 1,030 | 995 | 928 | 964 |
| 2001 | 673 | 483 | 736 | 541 | 635 | 806 | 650 | 757 | 723 | 644 | 527 | 673 |
| 2002 | 646 | 721 | 663 | 621 | 801 | 745 | 788 | 764 | 747 | 761 | 569 | 642 |
| 2003 | 692 | 557 | 638 | 753 | 692 | 644 | 504 | 621 | 621 | 599 | 607 | 703 |
| 2004 | 703 | 665 | 675 | 559 | 638 | 669 | 748 | 850 | 785 | 531 | 635 | 633 |
| 2005 | 584 | 686 | 619 | 635 | 721 | 635 | 671 | 664 | 543 | 731 | 726 | 612 |
| 2006 | 693 | 524 | 596 | 737 | 753 | 723 | 690 | 531 | 594 | 456 | 483 | 603 |
| 2007 | 645 | 542 | 578 | 413 | 458 | 301 | 552 | 553 | 642 | 496 | 620 | 620 |
| 2008 | 628 | 739 | 410 | 567 | 759 | 459 | 622 | 716 | 639 | 640 | 429 | 532 |
| 2009 | 744 | 463 | 369 | 750 | 421 | 462 | 560 | 557 | 631 | 483 | 427 | 531 |
| 2010 | 553 | 614 | 684 | 701 | 609 | 632 | 647 | 714 | 589 | 512 | 561 | 440 |
| 2011 | 556 | 578 | 620 | 575 | 694 | 661 | 729 | 637 | 788 | 566 | 536 | 607 |
| 2012 | 762 | 831 | 862 | 857 | 835 | 896 | 1,046 | 1,060 | 959 | 901 | 487 | 490 |
| 2013 | 862 | 814 | 502 | 563 | 653 | 1,015 | 767 | 724 | 576 | 637 | 623 | 554 |
| 2014 | 611 | 879 | 795 | 835 | 792 | 771 | 820 | 904 | 808 | 714 | 480 | 622 |
| 2015 | 767 | 723 | 719 | 930 | 964 | 937 | 969 | 914 | 755 | 768 | 664 | 622 |
| 2016 | 643 | 651 | 683 | 907 | 808 | 980 | 826 | 942 | 853 | 852 | 1,011 | 779 |
| 2017 | 961 | 804 | 999 | 840 | 977 | 849 | 898 | 811 | 844 | 599 | 748 | 791 |
| 2018 | 622 | 634 | 613 | 850 | 806 | 798 | 751 | 914 | 881 | 877 | 843 | 959 |
| 2019 | 857 | 608 | 706 | 868 | 751 | 798 | 1,061 | 988 | 938 | 849 | 908 | 570 |
| 2020 | 793 | 819 | 714 | 126 | 67 | 466 | 568 | 330 | 504 | 614 | 546 | 412 |
| 2021 | 575 | 180 | 626 | 677 | 848 | 917 | 960 | 989 | 866 | 867 | 1,010 | 973 |
| 2022 | 960 | 860 | 874 | 1,074 | 1,018 | 895 | 931 | 984 | 809 | 929 | 850 | 886 |
| 2023 | 1,099 | 890 | 1,083 | 1,005 | 1,056 | 930 | 1,031 | 1,130 | 678 | 745 | 961 | 913 |
| 2024 | 962 | |||||||||||
| - = No Data Reported; -- = Not Applicable; NA = Not Available; W = Withheld to avoid disclosure of individual company data. |
| Release Date: 3/29/2024 |
| Next Release Date: 4/30/2024 |