|
Download Data (XLS File) |
|
||||||||
|
||||||||
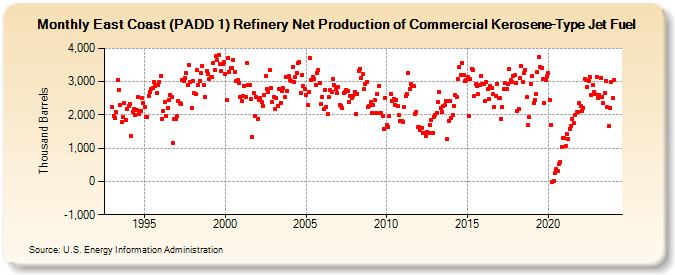
| East Coast (PADD 1) Refinery Net Production of Commercial Kerosene-Type Jet Fuel (Thousand Barrels) | ||||||||
| Year | Jan | Feb | Mar | Apr | May | Jun | Jul | Aug | Sep | Oct | Nov | Dec |
|---|---|---|---|---|---|---|---|---|---|---|---|---|
| 1993 | 2,237 | 1,975 | 1,905 | 2,079 | 3,046 | 2,763 | 2,307 | 1,789 | 1,942 | 2,349 | 1,855 | 2,184 |
| 1994 | 2,258 | 2,338 | 1,373 | 2,086 | 2,181 | 1,999 | 2,138 | 2,525 | 2,033 | 2,123 | 2,497 | 2,346 |
| 1995 | 2,226 | 1,948 | 1,942 | 2,581 | 2,701 | 2,789 | 2,823 | 3,000 | 2,872 | 2,644 | 2,885 | 2,989 |
| 1996 | 3,162 | 1,881 | 2,112 | 2,390 | 1,968 | 2,194 | 2,450 | 2,601 | 2,536 | 1,156 | 1,875 | 1,866 |
| 1997 | 1,954 | 2,419 | 2,353 | 2,316 | 3,042 | 3,021 | 3,096 | 3,246 | 2,903 | 3,491 | 2,977 | 2,204 |
| 1998 | 3,017 | 2,647 | 2,616 | 3,342 | 2,904 | 3,032 | 3,258 | 3,460 | 2,891 | 2,540 | 3,317 | 3,233 |
| 1999 | 3,084 | 3,145 | 3,135 | 3,558 | 3,356 | 3,759 | 3,660 | 3,799 | 3,534 | 3,329 | 3,540 | 3,595 |
| 2000 | 3,217 | 2,440 | 3,709 | 3,276 | 3,413 | 3,411 | 3,665 | 3,305 | 3,031 | 3,059 | 2,965 | 2,524 |
| 2001 | 2,414 | 2,559 | 2,884 | 2,553 | 3,559 | 2,895 | 2,910 | 2,483 | 1,328 | 2,644 | 1,969 | 2,534 |
| 2002 | 1,892 | 2,438 | 2,506 | 2,390 | 2,259 | 2,590 | 3,171 | 2,777 | 2,683 | 3,354 | 2,799 | 2,379 |
| 2003 | 2,549 | 2,176 | 2,501 | 2,272 | 2,788 | 2,369 | 2,724 | 2,817 | 2,525 | 3,138 | 2,717 | 3,184 |
| 2004 | 3,060 | 3,018 | 3,442 | 2,976 | 3,149 | 3,274 | 3,547 | 3,598 | 2,669 | 3,210 | 2,856 | 2,780 |
| 2005 | 2,596 | 2,293 | 2,704 | 3,717 | 3,057 | 3,132 | 3,080 | 2,911 | 3,251 | 3,341 | 2,949 | 2,343 |
| 2006 | 2,547 | 2,187 | 2,761 | 2,247 | 2,015 | 2,531 | 2,760 | 2,679 | 3,066 | 2,892 | 2,793 | 2,645 |
| 2007 | 2,843 | 2,285 | 2,276 | 2,215 | 2,673 | 2,689 | 2,761 | 2,723 | 2,375 | 2,573 | 2,523 | 2,565 |
| 2008 | 2,696 | 2,029 | 2,639 | 3,322 | 3,384 | 3,111 | 3,223 | 2,779 | 2,941 | 3,004 | 2,251 | 2,255 |
| 2009 | 2,379 | 2,067 | 2,292 | 2,455 | 2,053 | 2,627 | 2,866 | 2,046 | 2,059 | 1,966 | 1,563 | 2,515 |
| 2010 | 1,682 | 1,642 | 1,961 | 2,630 | 2,406 | 2,487 | 2,294 | 2,441 | 2,270 | 1,985 | 1,813 | 1,811 |
| 2011 | 1,794 | 2,246 | 2,557 | 2,639 | 3,271 | 2,793 | 2,940 | 2,877 | 2,856 | 2,028 | 2,098 | 1,627 |
| 2012 | 1,644 | 1,546 | 1,607 | 1,452 | 1,446 | 1,366 | 1,497 | 1,448 | 1,691 | 1,836 | 1,459 | 1,945 |
| 2013 | 2,012 | 2,058 | 2,383 | 2,680 | 2,218 | 2,088 | 2,270 | 2,288 | 2,423 | 1,266 | 1,832 | 2,420 |
| 2014 | 1,898 | 1,994 | 2,266 | 2,596 | 2,550 | 3,070 | 3,431 | 3,206 | 3,565 | 3,198 | 3,015 | 3,045 |
| 2015 | 3,151 | 1,963 | 3,082 | 3,390 | 3,355 | 2,557 | 2,919 | 2,876 | 2,620 | 2,905 | 3,163 | 2,942 |
| 2016 | 2,921 | 2,404 | 2,993 | 2,790 | 2,467 | 2,856 | 2,803 | 2,617 | 2,253 | 2,577 | 2,932 | 2,519 |
| 2017 | 2,494 | 1,882 | 2,231 | 2,767 | 2,948 | 2,779 | 2,916 | 3,377 | 3,038 | 2,978 | 3,155 | 3,190 |
| 2018 | 2,948 | 2,126 | 2,166 | 3,108 | 3,484 | 2,990 | 3,273 | 3,357 | 2,535 | 1,689 | 1,925 | 2,935 |
| 2019 | 3,168 | 2,370 | 2,454 | 2,625 | 3,279 | 3,743 | 3,437 | 3,419 | 3,066 | 2,367 | 3,060 | 3,158 |
| 2020 | 3,266 | 2,441 | 1,708 | -31 | 24 | 243 | 365 | 305 | 526 | 592 | 1,041 | 1,309 |
| 2021 | 1,314 | 1,073 | 1,415 | 1,263 | 1,591 | 1,671 | 1,874 | 1,763 | 1,997 | 2,077 | 2,083 | 2,362 |
| 2022 | 2,260 | 2,118 | 2,217 | 3,090 | 3,037 | 2,847 | 3,009 | 3,129 | 2,595 | 2,886 | 2,675 | 2,634 |
| 2023 | 3,141 | 2,506 | 2,609 | 3,113 | 2,550 | 2,355 | 2,644 | 3,017 | 2,237 | 1,653 | 2,222 | 2,978 |
| 2024 | 2,504 | |||||||||||
| - = No Data Reported; -- = Not Applicable; NA = Not Available; W = Withheld to avoid disclosure of individual company data. |
| Release Date: 3/29/2024 |
| Next Release Date: 4/30/2024 |