|
Download Data (XLS File) |
|
||||||||
|
||||||||
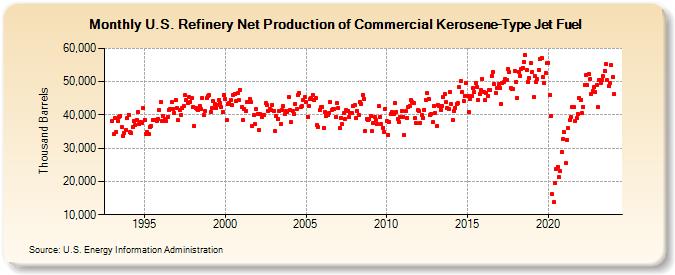
| U.S. Refinery Net Production of Commercial Kerosene-Type Jet Fuel (Thousand Barrels) | ||||||||
| Year | Jan | Feb | Mar | Apr | May | Jun | Jul | Aug | Sep | Oct | Nov | Dec |
|---|---|---|---|---|---|---|---|---|---|---|---|---|
| 1993 | 38,227 | 34,174 | 38,944 | 34,882 | 38,160 | 39,303 | 39,719 | 36,325 | 33,698 | 34,574 | 35,469 | 38,928 |
| 1994 | 40,087 | 34,747 | 34,696 | 36,457 | 38,169 | 36,933 | 38,524 | 40,966 | 37,131 | 38,021 | 37,474 | 42,124 |
| 1995 | 38,570 | 34,323 | 34,821 | 34,326 | 36,448 | 36,680 | 38,622 | 38,439 | 38,461 | 38,175 | 38,821 | 41,539 |
| 1996 | 43,949 | 38,273 | 39,656 | 38,798 | 38,113 | 39,520 | 41,542 | 41,769 | 43,866 | 41,685 | 40,594 | 44,497 |
| 1997 | 42,153 | 38,343 | 41,369 | 40,060 | 41,976 | 42,548 | 45,900 | 44,355 | 43,534 | 45,302 | 43,965 | 45,047 |
| 1998 | 42,403 | 36,610 | 42,208 | 41,728 | 41,470 | 42,704 | 41,771 | 45,017 | 39,958 | 41,109 | 44,937 | 45,592 |
| 1999 | 45,945 | 40,901 | 42,031 | 44,233 | 43,273 | 42,224 | 42,857 | 44,340 | 43,723 | 42,436 | 40,985 | 46,038 |
| 2000 | 44,759 | 38,349 | 43,399 | 43,663 | 44,514 | 42,866 | 46,063 | 46,409 | 44,097 | 46,547 | 44,479 | 47,604 |
| 2001 | 42,325 | 38,362 | 41,790 | 41,192 | 43,757 | 43,996 | 44,924 | 43,736 | 36,689 | 39,953 | 37,142 | 41,652 |
| 2002 | 40,424 | 35,610 | 40,232 | 39,495 | 40,012 | 40,058 | 43,464 | 42,966 | 41,278 | 41,843 | 41,376 | 43,068 |
| 2003 | 41,253 | 35,057 | 39,742 | 38,797 | 41,031 | 37,330 | 41,529 | 42,559 | 40,162 | 41,322 | 40,982 | 45,434 |
| 2004 | 41,546 | 37,757 | 41,228 | 40,421 | 43,313 | 41,700 | 46,029 | 46,657 | 42,286 | 42,713 | 44,503 | 45,321 |
| 2005 | 43,826 | 39,392 | 42,533 | 44,672 | 45,194 | 46,085 | 44,625 | 45,130 | 36,865 | 36,282 | 41,592 | 42,232 |
| 2006 | 42,518 | 36,198 | 41,012 | 39,741 | 40,066 | 40,454 | 43,945 | 41,507 | 41,820 | 41,737 | 39,327 | 43,451 |
| 2007 | 42,229 | 36,002 | 39,169 | 37,247 | 40,434 | 38,766 | 41,498 | 41,168 | 39,248 | 40,500 | 40,473 | 42,666 |
| 2008 | 42,881 | 39,092 | 41,156 | 40,017 | 43,857 | 43,357 | 46,061 | 44,893 | 35,231 | 38,907 | 38,422 | 38,695 |
| 2009 | 39,657 | 35,084 | 37,682 | 39,238 | 38,564 | 37,327 | 42,657 | 39,511 | 37,268 | 36,144 | 34,919 | 41,870 |
| 2010 | 38,286 | 34,105 | 37,897 | 40,385 | 40,822 | 40,362 | 43,648 | 40,951 | 38,728 | 37,831 | 39,252 | 41,241 |
| 2011 | 39,316 | 33,964 | 41,092 | 39,129 | 42,384 | 42,768 | 44,405 | 43,994 | 43,532 | 38,962 | 37,455 | 41,394 |
| 2012 | 41,216 | 37,608 | 40,032 | 39,042 | 41,611 | 44,587 | 46,499 | 44,896 | 39,857 | 40,389 | 37,756 | 42,800 |
| 2013 | 40,598 | 36,637 | 43,033 | 42,803 | 41,558 | 42,760 | 45,417 | 46,300 | 43,745 | 42,064 | 41,799 | 46,842 |
| 2014 | 43,198 | 38,385 | 41,225 | 42,182 | 43,351 | 43,495 | 48,358 | 50,096 | 46,812 | 44,095 | 45,746 | 49,676 |
| 2015 | 45,585 | 40,890 | 44,868 | 45,767 | 48,017 | 46,756 | 49,704 | 48,434 | 44,582 | 46,267 | 47,433 | 50,924 |
| 2016 | 46,936 | 44,339 | 46,692 | 45,707 | 47,379 | 47,505 | 51,777 | 52,939 | 49,284 | 46,626 | 48,114 | 49,219 |
| 2017 | 47,985 | 43,418 | 49,652 | 50,033 | 50,732 | 50,450 | 53,753 | 52,870 | 48,092 | 47,678 | 47,711 | 53,098 |
| 2018 | 49,992 | 45,109 | 53,019 | 51,829 | 53,765 | 54,049 | 56,041 | 57,980 | 53,503 | 50,019 | 51,036 | 55,530 |
| 2019 | 52,763 | 45,248 | 51,590 | 49,822 | 50,748 | 53,629 | 56,852 | 57,194 | 51,350 | 49,603 | 52,705 | 55,460 |
| 2020 | 55,663 | 46,040 | 39,636 | 16,183 | 13,746 | 19,532 | 23,854 | 24,361 | 21,253 | 23,074 | 28,985 | 32,774 |
| 2021 | 34,805 | 25,436 | 32,502 | 35,967 | 38,336 | 39,475 | 42,267 | 42,255 | 38,157 | 39,014 | 40,134 | 45,014 |
| 2022 | 44,396 | 40,573 | 42,511 | 49,106 | 51,888 | 48,899 | 52,168 | 50,662 | 46,154 | 47,144 | 48,355 | 46,828 |
| 2023 | 49,001 | 42,308 | 50,466 | 49,652 | 50,589 | 51,575 | 53,293 | 55,257 | 50,394 | 48,717 | 49,599 | 54,902 |
| 2024 | 51,318 | |||||||||||
| - = No Data Reported; -- = Not Applicable; NA = Not Available; W = Withheld to avoid disclosure of individual company data. |
| Release Date: 3/29/2024 |
| Next Release Date: 4/30/2024 |