|
Download Data (XLS File) |
|
||||||||
|
||||||||
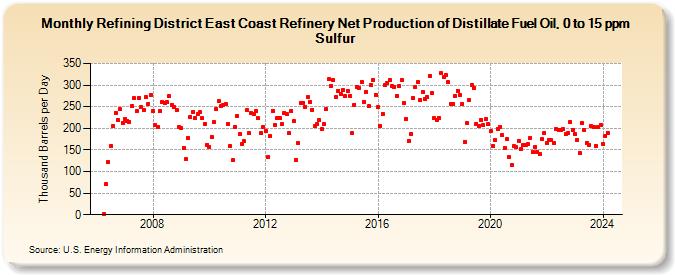
| Refining District East Coast Refinery Net Production of Distillate Fuel Oil, 0 to 15 ppm Sulfur (Thousand Barrels per Day) | ||||||||
| Year | Jan | Feb | Mar | Apr | May | Jun | Jul | Aug | Sep | Oct | Nov | Dec |
|---|---|---|---|---|---|---|---|---|---|---|---|---|
| 2006 | 1 | 70 | 121 | 160 | 206 | 236 | 220 | 244 | 213 | |||
| 2007 | 222 | 217 | 215 | 252 | 269 | 239 | 270 | 249 | 242 | 273 | 257 | 277 |
| 2008 | 240 | 208 | 204 | 239 | 262 | 259 | 260 | 274 | 254 | 250 | 243 | 203 |
| 2009 | 200 | 155 | 128 | 178 | 227 | 238 | 224 | 232 | 237 | 223 | 210 | 162 |
| 2010 | 157 | 180 | 214 | 245 | 263 | 252 | 253 | 256 | 209 | 159 | 126 | 203 |
| 2011 | 228 | 187 | 164 | 170 | 242 | 189 | 235 | 232 | 239 | 223 | 188 | 203 |
| 2012 | 194 | 134 | 182 | 241 | 208 | 223 | 224 | 209 | 236 | 233 | 189 | 240 |
| 2013 | 216 | 127 | 166 | 259 | 259 | 250 | 272 | 262 | 243 | 205 | 209 | 219 |
| 2014 | 198 | 209 | 245 | 313 | 299 | 311 | 272 | 287 | 279 | 289 | 274 | 287 |
| 2015 | 275 | 188 | 255 | 295 | 293 | 308 | 262 | 285 | 251 | 301 | 312 | 278 |
| 2016 | 249 | 205 | 234 | 300 | 305 | 312 | 298 | 296 | 275 | 298 | 312 | 259 |
| 2017 | 222 | 171 | 187 | 270 | 296 | 307 | 265 | 284 | 268 | 273 | 322 | 282 |
| 2018 | 223 | 220 | 224 | 327 | 318 | 324 | 306 | 256 | 256 | 275 | 287 | 277 |
| 2019 | 257 | 169 | 212 | 265 | 300 | 294 | 211 | 206 | 220 | 207 | 221 | 210 |
| 2020 | 193 | 159 | 173 | 199 | 203 | 184 | 155 | 175 | 133 | 114 | 158 | 156 |
| 2021 | 171 | 153 | 162 | 162 | 163 | 177 | 145 | 157 | 146 | 140 | 175 | 190 |
| 2022 | 167 | 172 | 172 | 166 | 198 | 196 | 195 | 198 | 186 | 190 | 215 | 197 |
| 2023 | 186 | 173 | 143 | 212 | 197 | 167 | 161 | 205 | 202 | 159 | 204 | 208 |
| 2024 | 163 | 183 | ||||||||||
| - = No Data Reported; -- = Not Applicable; NA = Not Available; W = Withheld to avoid disclosure of individual company data. |
| Release Date: 4/30/2024 |
| Next Release Date: 5/31/2024 |