|
Download Data (XLS File) |
|
||||||||
|
||||||||
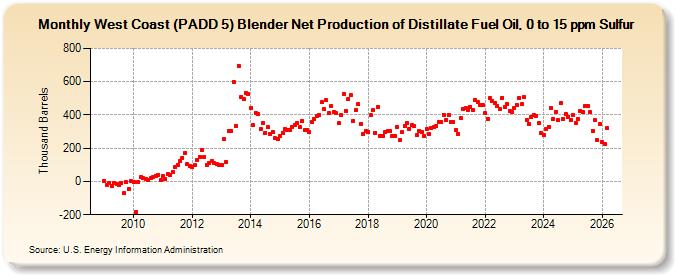
| West Coast (PADD 5) Blender Net Production of Distillate Fuel Oil, 0 to 15 ppm Sulfur (Thousand Barrels) | ||||||||
| Year | Jan | Feb | Mar | Apr | May | Jun | Jul | Aug | Sep | Oct | Nov | Dec |
|---|---|---|---|---|---|---|---|---|---|---|---|---|
| 2009 | 0 | -20 | -7 | -26 | -10 | -16 | -22 | -10 | -71 | -6 | -44 | 2 |
| 2010 | -1 | -182 | -2 | 24 | 19 | 16 | 9 | 19 | 24 | 33 | 41 | 7 |
| 2011 | 33 | 16 | 45 | 38 | 59 | 85 | 101 | 122 | 143 | 172 | 103 | 95 |
| 2012 | 87 | 97 | 127 | 150 | 189 | 149 | 100 | 112 | 123 | 108 | 102 | 99 |
| 2013 | 98 | 253 | 118 | 306 | 301 | 600 | 336 | 696 | 507 | 497 | 534 | 523 |
| 2014 | 440 | 337 | 411 | 404 | 316 | 352 | 294 | 326 | 284 | 298 | 259 | 253 |
| 2015 | 271 | 293 | 314 | 311 | 310 | 328 | 339 | 352 | 327 | 364 | 307 | 311 |
| 2016 | 296 | 355 | 376 | 393 | 401 | 477 | 434 | 488 | 409 | 453 | 419 | 410 |
| 2017 | 351 | 398 | 525 | 425 | 497 | 517 | 364 | 428 | 464 | 348 | 286 | 303 |
| 2018 | 296 | 398 | 429 | 294 | 448 | 274 | 276 | 297 | 302 | 302 | 273 | 272 |
| 2019 | 328 | 248 | 296 | 333 | 351 | 318 | 339 | 331 | 280 | 304 | 296 | 272 |
| 2020 | 314 | 287 | 322 | 326 | 334 | 356 | 358 | 402 | 372 | 402 | 360 | 357 |
| 2021 | 310 | 287 | 379 | 438 | 440 | 430 | 449 | 432 | 492 | 476 | 458 | 458 |
| 2022 | 410 | 377 | 499 | 481 | 469 | 456 | 438 | 504 | 450 | 468 | 426 | 418 |
| 2023 | 439 | 440 | 503 | 464 | 507 | 418 | 396 | 417 | 458 | 395 | 349 | 289 |
| 2024 | 278 | |||||||||||
| - = No Data Reported; -- = Not Applicable; NA = Not Available; W = Withheld to avoid disclosure of individual company data. |
| Release Date: 3/29/2024 |
| Next Release Date: 4/30/2024 |