|
Download Data (XLS File) |
|
||||||||
|
||||||||
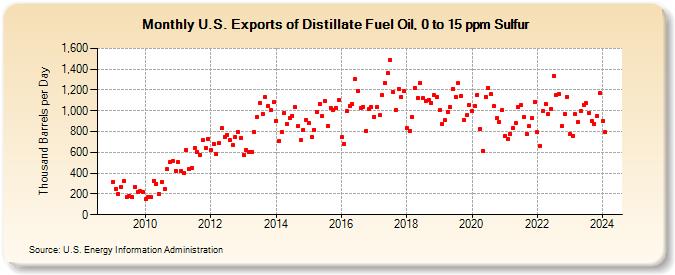
| U.S. Exports of Distillate Fuel Oil, 0 to 15 ppm Sulfur (Thousand Barrels per Day) | ||||||||
| Year | Jan | Feb | Mar | Apr | May | Jun | Jul | Aug | Sep | Oct | Nov | Dec |
|---|---|---|---|---|---|---|---|---|---|---|---|---|
| 2009 | 319 | 251 | 201 | 270 | 325 | 169 | 178 | 175 | 269 | 219 | 228 | 218 |
| 2010 | 151 | 169 | 174 | 328 | 300 | 200 | 318 | 252 | 435 | 503 | 513 | 423 |
| 2011 | 505 | 423 | 405 | 621 | 442 | 449 | 646 | 602 | 576 | 717 | 644 | 733 |
| 2012 | 621 | 683 | 581 | 688 | 834 | 751 | 769 | 715 | 672 | 747 | 796 | 738 |
| 2013 | 576 | 625 | 601 | 608 | 796 | 943 | 1,077 | 972 | 1,131 | 1,050 | 1,008 | 1,080 |
| 2014 | 903 | 708 | 798 | 980 | 872 | 931 | 952 | 1,034 | 857 | 715 | 819 | 914 |
| 2015 | 880 | 746 | 818 | 992 | 1,069 | 947 | 1,096 | 854 | 1,028 | 1,009 | 1,026 | 1,108 |
| 2016 | 743 | 684 | 994 | 1,044 | 1,062 | 1,303 | 1,194 | 1,023 | 1,040 | 806 | 1,016 | 1,034 |
| 2017 | 944 | 1,032 | 955 | 1,150 | 1,266 | 1,359 | 1,492 | 1,180 | 1,010 | 1,211 | 1,133 | 1,191 |
| 2018 | 832 | 804 | 941 | 1,222 | 1,122 | 1,269 | 1,119 | 1,096 | 1,106 | 1,075 | 1,147 | 1,132 |
| 2019 | 1,005 | 873 | 908 | 990 | 1,036 | 1,213 | 1,130 | 1,263 | 1,144 | 907 | 956 | 1,054 |
| 2020 | 995 | 1,044 | 1,156 | 825 | 613 | 1,131 | 1,223 | 1,158 | 1,043 | 930 | 891 | 1,004 |
| 2021 | 756 | 730 | 777 | 833 | 878 | 1,039 | 1,054 | 941 | 778 | 853 | 931 | 1,088 |
| 2022 | 793 | 661 | 995 | 1,066 | 970 | 1,015 | 1,338 | 1,151 | 1,159 | 852 | 968 | 1,134 |
| 2023 | 756 | 755 | 977 | 897 | 989 | 1,051 | 1,129 | 1,048 | 917 | 881 | 979 | 1,129 |
| 2024 | 900 | 794 | 990 | 1,114 | 1,082 | 1,278 | ||||||
| - = No Data Reported; -- = Not Applicable; NA = Not Available; W = Withheld to avoid disclosure of individual company data. |
| Release Date: 8/30/2024 |
| Next Release Date: 9/30/2024 |