|
Download Data (XLS File) |
|
||||||||
|
||||||||
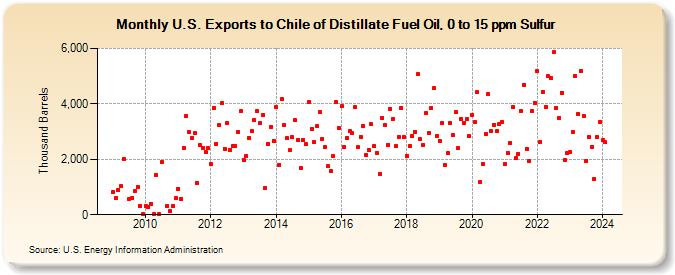
| U.S. Exports to Chile of Distillate Fuel Oil, 0 to 15 ppm Sulfur (Thousand Barrels) | ||||||||
| Year | Jan | Feb | Mar | Apr | May | Jun | Jul | Aug | Sep | Oct | Nov | Dec |
|---|---|---|---|---|---|---|---|---|---|---|---|---|
| 2009 | 819 | 604 | 895 | 1,025 | 2,003 | 571 | 619 | 867 | 998 | 316 | 16 | |
| 2010 | 312 | 277 | 401 | 14 | 1,432 | 15 | 1,906 | 326 | 117 | 310 | 586 | |
| 2011 | 938 | 574 | 2,402 | 3,565 | 2,969 | 2,774 | 2,931 | 1,152 | 2,501 | 2,417 | 2,249 | 2,391 |
| 2012 | 1,832 | 3,859 | 2,554 | 3,226 | 4,014 | 2,378 | 3,317 | 2,339 | 2,471 | 2,471 | 2,996 | 3,732 |
| 2013 | 1,982 | 2,111 | 2,774 | 3,018 | 3,410 | 3,730 | 3,308 | 3,614 | 963 | 2,566 | 3,174 | 2,677 |
| 2014 | 3,875 | 1,809 | 4,161 | 3,222 | 2,751 | 2,320 | 2,788 | 3,403 | 2,688 | 1,684 | 2,691 | 2,543 |
| 2015 | 4,064 | 3,104 | 2,617 | 3,184 | 3,693 | 2,743 | 2,441 | 1,743 | 1,577 | 2,108 | 4,060 | 3,129 |
| 2016 | 3,908 | 2,440 | 2,760 | 3,018 | 2,936 | 3,880 | 2,433 | 2,818 | 3,203 | 2,162 | 2,340 | 3,255 |
| 2017 | 2,478 | 2,238 | 1,483 | 3,505 | 3,220 | 2,531 | 3,822 | 3,464 | 2,468 | 2,817 | 3,860 | 2,798 |
| 2018 | 2,125 | 2,494 | 2,829 | 2,988 | 5,061 | 2,722 | 2,530 | 3,664 | 2,956 | 3,841 | 4,561 | 2,845 |
| 2019 | 2,666 | 3,309 | 1,784 | 2,223 | 3,300 | 2,864 | 3,690 | 2,395 | 3,444 | 3,311 | 3,459 | 2,829 |
| 2020 | 3,615 | 3,342 | 4,425 | 1,189 | 1,832 | 2,919 | 4,349 | 3,004 | 3,250 | 3,004 | 3,267 | 3,349 |
| 2021 | 1,817 | 2,228 | 2,591 | 3,873 | 2,034 | 2,205 | 3,741 | 4,692 | 2,373 | 1,927 | 3,755 | 4,036 |
| 2022 | 5,167 | 2,624 | 4,437 | 3,890 | 4,995 | 4,936 | 5,854 | 3,866 | 3,492 | 4,407 | 1,960 | 2,218 |
| 2023 | 2,247 | 2,971 | 5,003 | 3,638 | 5,195 | 3,564 | 1,951 | 2,789 | 2,458 | 1,300 | 2,791 | 3,361 |
| 2024 | 2,680 | |||||||||||
| - = No Data Reported; -- = Not Applicable; NA = Not Available; W = Withheld to avoid disclosure of individual company data. |
| Release Date: 3/29/2024 |
| Next Release Date: 4/30/2024 |