|
Download Data (XLS File) |
|
||||||||
|
||||||||
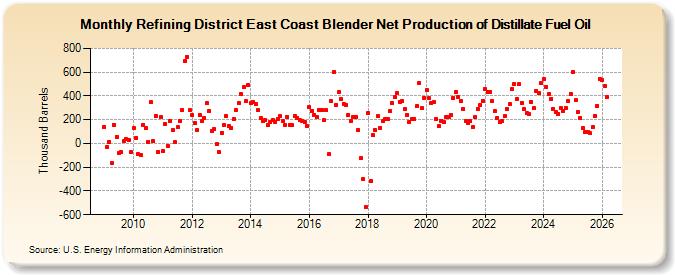
| Refining District East Coast Blender Net Production of Distillate Fuel Oil (Thousand Barrels) | ||||||||
| Year | Jan | Feb | Mar | Apr | May | Jun | Jul | Aug | Sep | Oct | Nov | Dec |
|---|---|---|---|---|---|---|---|---|---|---|---|---|
| 2009 | 138 | -27 | 13 | -166 | 158 | 58 | -79 | -76 | 21 | 36 | 26 | -75 |
| 2010 | 128 | 48 | -93 | -99 | 159 | 130 | 13 | 346 | 18 | 234 | -68 | 221 |
| 2011 | -65 | 162 | -19 | 189 | 112 | 9 | 136 | 192 | 280 | 691 | 729 | 278 |
| 2012 | 238 | 174 | 112 | 239 | 187 | 216 | 337 | 271 | 107 | 119 | -5 | -73 |
| 2013 | 90 | 154 | 229 | 143 | 132 | 205 | 284 | 342 | 418 | 472 | 354 | 490 |
| 2014 | 341 | 345 | 333 | 279 | 211 | 185 | 197 | 156 | 180 | 194 | 184 | 209 |
| 2015 | 230 | 189 | 158 | 226 | 158 | 151 | 235 | 216 | 194 | 192 | 180 | 144 |
| 2016 | 304 | 276 | 240 | 224 | 283 | 284 | 194 | 278 | -92 | 354 | 605 | 322 |
| 2017 | 432 | 371 | 335 | 326 | 242 | 193 | 226 | 226 | 115 | -123 | -302 | -533 |
| 2018 | 253 | -318 | 69 | 113 | 232 | 133 | 185 | 204 | 204 | 272 | 340 | 391 |
| 2019 | 423 | 352 | 353 | 289 | 242 | 184 | 205 | 207 | 312 | 511 | 295 | 386 |
| 2020 | 450 | 379 | 342 | 345 | 204 | 146 | 193 | 179 | 220 | 224 | 241 | 386 |
| 2021 | 434 | 390 | 357 | 289 | 193 | 175 | 186 | 140 | 220 | 292 | 321 | 361 |
| 2022 | 454 | 432 | 432 | 354 | 270 | 215 | 182 | 193 | 227 | 289 | 328 | 459 |
| 2023 | 499 | 376 | 497 | 341 | 287 | 254 | 246 | 352 | 291 | 444 | 424 | 506 |
| 2024 | 531 | |||||||||||
| - = No Data Reported; -- = Not Applicable; NA = Not Available; W = Withheld to avoid disclosure of individual company data. |
| Release Date: 3/29/2024 |
| Next Release Date: 4/30/2024 |