|
Download Data (XLS File) |
|
||||||||
|
||||||||
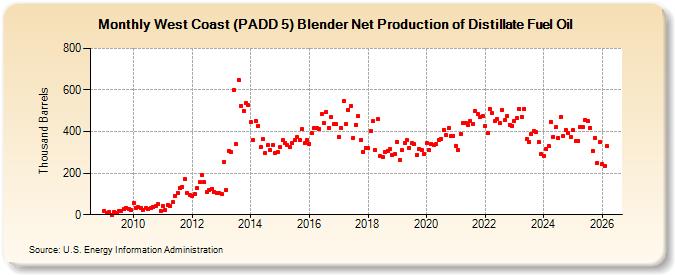
| West Coast (PADD 5) Blender Net Production of Distillate Fuel Oil (Thousand Barrels) | ||||||||
| Year | Jan | Feb | Mar | Apr | May | Jun | Jul | Aug | Sep | Oct | Nov | Dec |
|---|---|---|---|---|---|---|---|---|---|---|---|---|
| 2009 | 20 | 8 | 13 | 0 | 13 | 8 | 19 | 20 | 26 | 34 | 27 | 22 |
| 2010 | 56 | 34 | 35 | 31 | 25 | 33 | 27 | 30 | 38 | 40 | 50 | 17 |
| 2011 | 42 | 22 | 47 | 42 | 59 | 89 | 106 | 127 | 135 | 170 | 104 | 97 |
| 2012 | 89 | 100 | 130 | 156 | 192 | 156 | 107 | 117 | 125 | 111 | 105 | 103 |
| 2013 | 101 | 255 | 120 | 308 | 303 | 601 | 338 | 648 | 525 | 499 | 537 | 527 |
| 2014 | 445 | 360 | 452 | 429 | 324 | 363 | 296 | 333 | 311 | 336 | 297 | 302 |
| 2015 | 324 | 357 | 347 | 335 | 324 | 346 | 357 | 373 | 358 | 411 | 343 | 359 |
| 2016 | 341 | 393 | 415 | 417 | 414 | 483 | 441 | 495 | 419 | 468 | 437 | 434 |
| 2017 | 375 | 418 | 545 | 435 | 505 | 523 | 370 | 433 | 473 | 360 | 303 | 322 |
| 2018 | 319 | 402 | 449 | 309 | 458 | 282 | 277 | 304 | 308 | 314 | 289 | 292 |
| 2019 | 352 | 264 | 312 | 347 | 359 | 321 | 343 | 338 | 288 | 318 | 310 | 293 |
| 2020 | 344 | 309 | 342 | 337 | 340 | 361 | 364 | 408 | 382 | 417 | 378 | 379 |
| 2021 | 332 | 309 | 390 | 442 | 443 | 433 | 451 | 437 | 498 | 483 | 470 | 473 |
| 2022 | 425 | 391 | 509 | 487 | 450 | 459 | 441 | 506 | 454 | 474 | 433 | 428 |
| 2023 | 451 | 448 | 510 | 472 | 514 | 416 | 399 | 417 | 458 | 397 | 352 | 292 |
| 2024 | 284 | |||||||||||
| - = No Data Reported; -- = Not Applicable; NA = Not Available; W = Withheld to avoid disclosure of individual company data. |
| Release Date: 3/29/2024 |
| Next Release Date: 4/30/2024 |