|
Download Data (XLS File) |
|
||||||||
|
||||||||
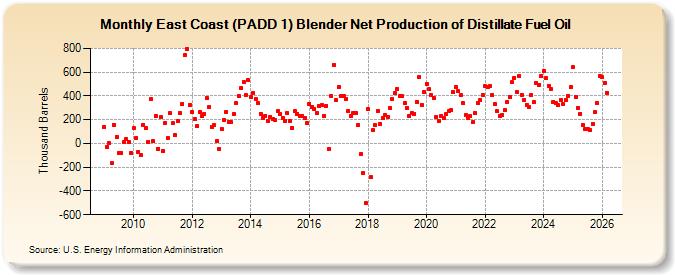
| East Coast (PADD 1) Blender Net Production of Distillate Fuel Oil (Thousand Barrels) | ||||||||
| Year | Jan | Feb | Mar | Apr | May | Jun | Jul | Aug | Sep | Oct | Nov | Dec |
|---|---|---|---|---|---|---|---|---|---|---|---|---|
| 2009 | 138 | -27 | 1 | -167 | 158 | 58 | -80 | -78 | 15 | 35 | 11 | -77 |
| 2010 | 126 | 47 | -70 | -100 | 159 | 130 | 13 | 371 | 18 | 234 | -44 | 222 |
| 2011 | -65 | 175 | 46 | 253 | 169 | 70 | 187 | 252 | 335 | 742 | 793 | 327 |
| 2012 | 264 | 202 | 144 | 264 | 230 | 251 | 381 | 308 | 141 | 152 | 21 | -45 |
| 2013 | 123 | 197 | 267 | 184 | 178 | 248 | 337 | 399 | 466 | 516 | 404 | 531 |
| 2014 | 388 | 421 | 375 | 337 | 250 | 217 | 235 | 193 | 223 | 206 | 200 | 270 |
| 2015 | 245 | 216 | 190 | 258 | 190 | 133 | 270 | 251 | 233 | 232 | 213 | 174 |
| 2016 | 335 | 310 | 292 | 256 | 317 | 323 | 233 | 319 | -48 | 398 | 664 | 365 |
| 2017 | 478 | 396 | 400 | 376 | 275 | 234 | 259 | 260 | 154 | -91 | -249 | -501 |
| 2018 | 288 | -285 | 109 | 152 | 273 | 167 | 216 | 240 | 224 | 298 | 371 | 425 |
| 2019 | 457 | 399 | 398 | 337 | 299 | 227 | 252 | 251 | 352 | 558 | 327 | 430 |
| 2020 | 501 | 455 | 405 | 381 | 223 | 192 | 232 | 210 | 248 | 269 | 282 | 429 |
| 2021 | 474 | 438 | 406 | 337 | 238 | 210 | 228 | 179 | 252 | 342 | 369 | 409 |
| 2022 | 482 | 474 | 480 | 408 | 329 | 270 | 227 | 243 | 279 | 350 | 389 | 517 |
| 2023 | 550 | 437 | 569 | 411 | 368 | 327 | 308 | 406 | 341 | 510 | 496 | 564 |
| 2024 | 604 | |||||||||||
| - = No Data Reported; -- = Not Applicable; NA = Not Available; W = Withheld to avoid disclosure of individual company data. |
| Release Date: 3/29/2024 |
| Next Release Date: 4/30/2024 |