|
Download Data (XLS File) |
|
||||||||
|
||||||||
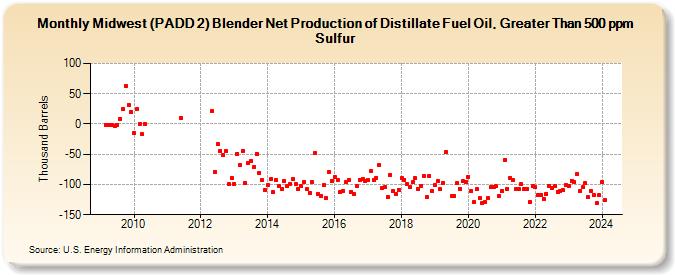
| Midwest (PADD 2) Blender Net Production of Distillate Fuel Oil, Greater Than 500 ppm Sulfur (Thousand Barrels) | ||||||||
| Year | Jan | Feb | Mar | Apr | May | Jun | Jul | Aug | Sep | Oct | Nov | Dec |
|---|---|---|---|---|---|---|---|---|---|---|---|---|
| 2009 | -1 | -1 | -1 | -3 | -1 | 9 | 25 | 63 | 32 | 19 | ||
| 2010 | -15 | 24 | 0 | -17 | 0 | |||||||
| 2011 | 10 | |||||||||||
| 2012 | 21 | -79 | -33 | -45 | -52 | -45 | -100 | -89 | ||||
| 2013 | -99 | -49 | -67 | -44 | -97 | -65 | -61 | -71 | -49 | -81 | -93 | -109 |
| 2014 | -101 | -91 | -113 | -93 | -102 | -107 | -94 | -103 | -99 | -91 | -100 | -108 |
| 2015 | -103 | -96 | -108 | -114 | -96 | -48 | -115 | -119 | -101 | -123 | -79 | -94 |
| 2016 | -87 | -92 | -112 | -111 | -96 | -92 | -112 | -116 | -103 | -92 | -91 | -94 |
| 2017 | -93 | -77 | -93 | -89 | -68 | -106 | -104 | -120 | -84 | -111 | -115 | -109 |
| 2018 | -89 | -92 | -99 | -104 | -96 | -90 | -107 | -102 | -86 | -121 | -86 | -111 |
| 2019 | -101 | -95 | -108 | -97 | -46 | -119 | -119 | -98 | -107 | -95 | -96 | |
| 2020 | -87 | -111 | -129 | -108 | -123 | -131 | -129 | -123 | -105 | -105 | -103 | -119 |
| 2021 | -110 | -59 | -107 | -89 | -92 | -108 | -108 | -100 | -107 | -107 | -129 | -103 |
| 2022 | -105 | -117 | -117 | -124 | -115 | -102 | -106 | -103 | -112 | -110 | -109 | -101 |
| 2023 | -103 | -94 | -96 | -83 | -111 | -105 | -98 | -121 | -110 | -118 | -131 | -118 |
| 2024 | -96 | -126 | -122 | -127 | -98 | -90 | ||||||
| - = No Data Reported; -- = Not Applicable; NA = Not Available; W = Withheld to avoid disclosure of individual company data. |
| Release Date: 8/30/2024 |
| Next Release Date: 9/30/2024 |