|
Download Data (XLS File) |
|
||||||||
|
||||||||
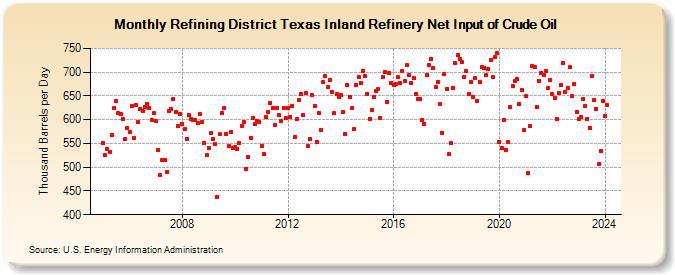
| Refining District Texas Inland Refinery Net Input of Crude Oil (Thousand Barrels per Day) | ||||||||
| Year | Jan | Feb | Mar | Apr | May | Jun | Jul | Aug | Sep | Oct | Nov | Dec |
|---|---|---|---|---|---|---|---|---|---|---|---|---|
| 2005 | 550 | 525 | 538 | 531 | 568 | 625 | 639 | 614 | 611 | 601 | 559 | 583 |
| 2006 | 574 | 629 | 561 | 631 | 595 | 622 | 619 | 626 | 633 | 624 | 600 | 613 |
| 2007 | 598 | 536 | 483 | 515 | 515 | 490 | 619 | 622 | 643 | 616 | 587 | 611 |
| 2008 | 591 | 580 | 560 | 609 | 602 | 599 | 599 | 592 | 611 | 595 | 551 | 525 |
| 2009 | 541 | 571 | 560 | 548 | 438 | 569 | 615 | 624 | 570 | 544 | 574 | 540 |
| 2010 | 543 | 539 | 551 | 587 | 596 | 497 | 522 | 562 | 603 | 590 | 597 | 595 |
| 2011 | 545 | 528 | 605 | 616 | 636 | 624 | 588 | 625 | 610 | 597 | 624 | 604 |
| 2012 | 625 | 606 | 629 | 564 | 601 | 641 | 654 | 610 | 657 | 545 | 560 | 651 |
| 2013 | 629 | 554 | 613 | 579 | 679 | 691 | 669 | 683 | 659 | 613 | 653 | 648 |
| 2014 | 651 | 617 | 569 | 674 | 648 | 624 | 580 | 674 | 690 | 678 | 703 | 692 |
| 2015 | 655 | 602 | 621 | 647 | 661 | 665 | 604 | 689 | 701 | 637 | 699 | 678 |
| 2016 | 673 | 676 | 689 | 677 | 702 | 681 | 714 | 694 | 678 | 687 | 654 | 644 |
| 2017 | 643 | 600 | 591 | 695 | 715 | 728 | 708 | 669 | 680 | 632 | 573 | 696 |
| 2018 | 665 | 527 | 550 | 667 | 719 | 736 | 727 | 721 | 690 | 702 | 653 | 680 |
| 2019 | 647 | 687 | 639 | 680 | 710 | 709 | 694 | 706 | 725 | 689 | 731 | 740 |
| 2020 | 554 | 541 | 600 | 536 | 552 | 626 | 671 | 681 | 686 | 632 | 662 | 578 |
| 2021 | 649 | 487 | 587 | 712 | 710 | 627 | 682 | 699 | 694 | 702 | 666 | 683 |
| 2022 | 654 | 646 | 602 | 656 | 672 | 719 | 659 | 667 | 710 | 650 | 676 | 617 |
| 2023 | 601 | 605 | 643 | 629 | 602 | 583 | 692 | 641 | 623 | 507 | 534 | 640 |
| 2024 | 607 | 631 | ||||||||||
| - = No Data Reported; -- = Not Applicable; NA = Not Available; W = Withheld to avoid disclosure of individual company data. |
| Release Date: 4/30/2024 |
| Next Release Date: 5/31/2024 |
Referring Pages: