|
Download Data (XLS File) |
|
||||||||
|
||||||||
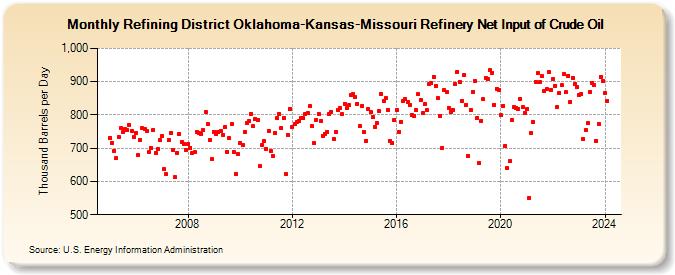
| Refining District Oklahoma-Kansas-Missouri Refinery Net Input of Crude Oil (Thousand Barrels per Day) | ||||||||
| Year | Jan | Feb | Mar | Apr | May | Jun | Jul | Aug | Sep | Oct | Nov | Dec |
|---|---|---|---|---|---|---|---|---|---|---|---|---|
| 2005 | 732 | 717 | 693 | 669 | 733 | 760 | 748 | 758 | 754 | 769 | 752 | 735 |
| 2006 | 747 | 679 | 726 | 760 | 759 | 751 | 688 | 700 | 754 | 687 | 697 | 724 |
| 2007 | 738 | 636 | 621 | 724 | 747 | 695 | 612 | 687 | 744 | 718 | 713 | 695 |
| 2008 | 714 | 702 | 687 | 689 | 750 | 747 | 744 | 754 | 809 | 772 | 725 | 666 |
| 2009 | 750 | 744 | 748 | 752 | 740 | 763 | 690 | 730 | 772 | 690 | 622 | 682 |
| 2010 | 717 | 711 | 749 | 776 | 781 | 804 | 766 | 788 | 786 | 645 | 711 | 722 |
| 2011 | 699 | 753 | 691 | 678 | 747 | 791 | 804 | 761 | 790 | 623 | 740 | 819 |
| 2012 | 765 | 773 | 778 | 783 | 792 | 790 | 804 | 806 | 826 | 767 | 716 | 786 |
| 2013 | 804 | 783 | 737 | 744 | 750 | 803 | 810 | 728 | 749 | 815 | 822 | 802 |
| 2014 | 834 | 820 | 829 | 860 | 863 | 853 | 834 | 766 | 827 | 748 | 722 | 818 |
| 2015 | 808 | 793 | 765 | 776 | 811 | 863 | 843 | 851 | 816 | 723 | 716 | 786 |
| 2016 | 816 | 750 | 780 | 841 | 847 | 839 | 830 | 800 | 798 | 815 | 862 | 844 |
| 2017 | 806 | 832 | 814 | 892 | 896 | 914 | 888 | 850 | 798 | 702 | 874 | 869 |
| 2018 | 821 | 810 | 815 | 892 | 930 | 900 | 843 | 919 | 831 | 677 | 815 | 870 |
| 2019 | 902 | 791 | 655 | 782 | 847 | 912 | 907 | 934 | 927 | 831 | 879 | 875 |
| 2020 | 799 | 828 | 707 | 639 | 662 | 785 | 823 | 822 | 819 | 848 | 823 | 807 |
| 2021 | 819 | 551 | 745 | 778 | 900 | 926 | 898 | 916 | 872 | 878 | 929 | 876 |
| 2022 | 909 | 888 | 824 | 867 | 889 | 923 | 868 | 918 | 839 | 912 | 893 | 883 |
| 2023 | 860 | 864 | 727 | 754 | 775 | 870 | 897 | 891 | 723 | 773 | 915 | 903 |
| 2024 | 866 | 842 | ||||||||||
| - = No Data Reported; -- = Not Applicable; NA = Not Available; W = Withheld to avoid disclosure of individual company data. |
| Release Date: 4/30/2024 |
| Next Release Date: 5/31/2024 |