|
Download Data (XLS File) |
|
||||||||
|
||||||||
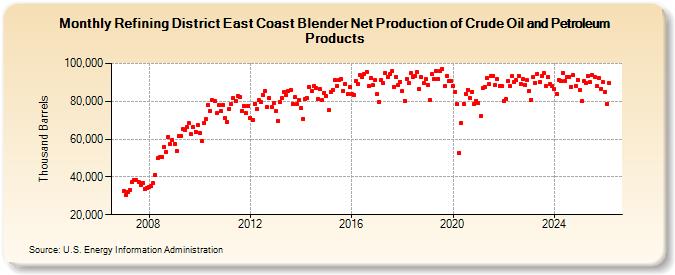
| Refining District East Coast Blender Net Production of Crude Oil and Petroleum Products (Thousand Barrels) | ||||||||
| Year | Jan | Feb | Mar | Apr | May | Jun | Jul | Aug | Sep | Oct | Nov | Dec |
|---|---|---|---|---|---|---|---|---|---|---|---|---|
| 2007 | 32,508 | 30,405 | 32,268 | 33,323 | 37,511 | 38,464 | 38,203 | 37,069 | 35,559 | 37,009 | 33,695 | 34,185 |
| 2008 | 34,795 | 34,951 | 36,730 | 41,011 | 49,824 | 50,389 | 50,762 | 55,820 | 53,238 | 61,317 | 57,257 | 59,703 |
| 2009 | 57,583 | 53,775 | 61,497 | 61,791 | 65,087 | 64,592 | 66,276 | 68,315 | 62,454 | 66,327 | 63,915 | 67,283 |
| 2010 | 62,974 | 58,939 | 68,740 | 70,567 | 78,059 | 74,963 | 80,434 | 80,169 | 73,767 | 78,110 | 74,808 | 78,101 |
| 2011 | 71,029 | 68,962 | 76,010 | 78,562 | 81,629 | 79,943 | 82,855 | 82,439 | 74,925 | 77,660 | 73,723 | 77,611 |
| 2012 | 71,300 | 69,917 | 78,811 | 75,917 | 80,518 | 79,685 | 83,487 | 85,376 | 76,810 | 81,829 | 76,891 | 79,015 |
| 2013 | 74,781 | 69,644 | 79,406 | 81,605 | 85,115 | 83,178 | 85,432 | 85,998 | 78,704 | 82,075 | 78,338 | 80,583 |
| 2014 | 76,188 | 70,855 | 81,407 | 81,483 | 87,810 | 85,219 | 87,834 | 87,205 | 81,268 | 86,336 | 80,442 | 84,530 |
| 2015 | 82,726 | 75,294 | 84,780 | 85,880 | 91,132 | 88,223 | 91,476 | 91,758 | 85,671 | 89,317 | 83,643 | 87,667 |
| 2016 | 83,931 | 83,485 | 90,785 | 89,080 | 93,707 | 92,616 | 94,435 | 95,745 | 87,981 | 92,450 | 88,355 | 91,427 |
| 2017 | 83,798 | 79,844 | 91,344 | 89,491 | 95,130 | 93,090 | 94,312 | 95,815 | 87,613 | 92,616 | 88,666 | 90,369 |
| 2018 | 85,394 | 80,408 | 91,985 | 89,545 | 94,812 | 92,913 | 93,452 | 95,264 | 86,650 | 92,619 | 89,630 | 91,737 |
| 2019 | 88,623 | 80,898 | 94,197 | 91,778 | 96,136 | 91,964 | 95,933 | 97,115 | 87,933 | 93,632 | 90,658 | 90,568 |
| 2020 | 88,187 | 85,023 | 78,393 | 52,695 | 68,540 | 78,581 | 84,102 | 86,171 | 81,723 | 85,000 | 78,378 | 80,417 |
| 2021 | 78,896 | 72,082 | 87,138 | 87,755 | 92,226 | 88,987 | 93,544 | 93,604 | 88,455 | 91,682 | 88,230 | 88,046 |
| 2022 | 80,197 | 81,063 | 90,546 | 87,853 | 93,295 | 90,130 | 91,045 | 93,592 | 88,925 | 91,666 | 88,784 | 91,111 |
| 2023 | 85,105 | 80,970 | 92,766 | 89,897 | 94,455 | 90,084 | 93,188 | 95,096 | 87,977 | 92,758 | 88,959 | 88,038 |
| 2024 | 86,248 | |||||||||||
| - = No Data Reported; -- = Not Applicable; NA = Not Available; W = Withheld to avoid disclosure of individual company data. |
| Release Date: 3/29/2024 |
| Next Release Date: 4/30/2024 |