|
Download Data (XLS File) |
|
||||||||
|
||||||||
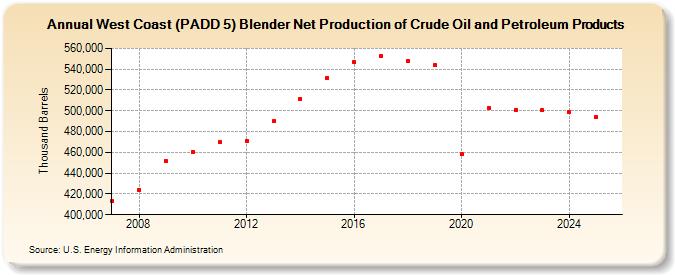
| West Coast (PADD 5) Blender Net Production of Crude Oil and Petroleum Products (Thousand Barrels) | ||||||||
| Decade | Year-0 | Year-1 | Year-2 | Year-3 | Year-4 | Year-5 | Year-6 | Year-7 | Year-8 | Year-9 |
|---|---|---|---|---|---|---|---|---|---|---|
| 2000's | 412,820 | 424,065 | 451,681 | |||||||
| 2010's | 460,775 | 469,612 | 470,759 | 490,119 | 511,579 | 531,646 | 546,868 | 552,199 | 548,333 | 543,731 |
| 2020's | 458,127 | 502,578 | 500,948 | 500,319 |
| - = No Data Reported; -- = Not Applicable; NA = Not Available; W = Withheld to avoid disclosure of individual company data. |
| Release Date: 3/29/2024 |
| Next Release Date: 8/30/2024 |