|
Download Data (XLS File) |
|
||||||||
|
||||||||
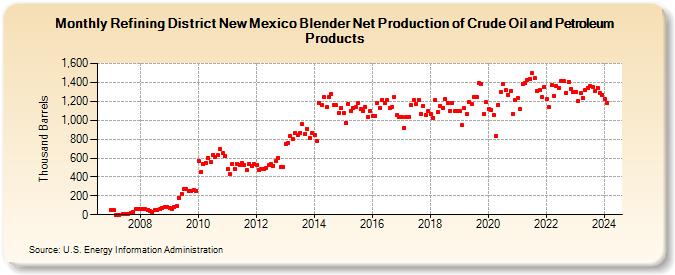
| Refining District New Mexico Blender Net Production of Crude Oil and Petroleum Products (Thousand Barrels) | ||||||||
| Year | Jan | Feb | Mar | Apr | May | Jun | Jul | Aug | Sep | Oct | Nov | Dec |
|---|---|---|---|---|---|---|---|---|---|---|---|---|
| 2007 | 52 | 45 | 0 | 0 | 5 | 6 | 7 | 22 | 25 | 58 | 62 | |
| 2008 | 60 | 63 | 58 | 47 | 40 | 30 | 48 | 53 | 61 | 75 | 82 | 85 |
| 2009 | 75 | 64 | 84 | 92 | 177 | 224 | 268 | 271 | 248 | 252 | 260 | 252 |
| 2010 | 568 | 454 | 533 | 552 | 601 | 558 | 633 | 608 | 628 | 696 | 650 | 617 |
| 2011 | 483 | 428 | 540 | 481 | 536 | 527 | 547 | 522 | 469 | 538 | 513 | 539 |
| 2012 | 530 | 475 | 487 | 488 | 496 | 522 | 532 | 520 | 567 | 603 | 504 | 506 |
| 2013 | 743 | 761 | 837 | 802 | 865 | 839 | 868 | 962 | 857 | 907 | 810 | 863 |
| 2014 | 840 | 779 | 1,186 | 1,161 | 1,245 | 1,138 | 1,242 | 1,276 | 1,164 | 1,157 | 1,080 | 1,134 |
| 2015 | 1,078 | 970 | 1,175 | 1,094 | 1,127 | 1,135 | 1,177 | 1,116 | 1,100 | 1,143 | 1,034 | 1,097 |
| 2016 | 1,048 | 1,048 | 1,186 | 1,132 | 1,217 | 1,181 | 1,209 | 1,129 | 1,140 | 1,247 | 1,051 | 1,036 |
| 2017 | 1,029 | 921 | 1,031 | 1,039 | 1,157 | 1,216 | 1,176 | 1,217 | 1,067 | 1,154 | 1,057 | 1,100 |
| 2018 | 1,064 | 1,027 | 1,212 | 1,089 | 1,150 | 1,133 | 1,223 | 1,186 | 1,099 | 1,185 | 1,094 | 1,097 |
| 2019 | 1,098 | 951 | 1,125 | 1,063 | 1,197 | 1,175 | 1,247 | 1,250 | 1,391 | 1,383 | 1,066 | 1,189 |
| 2020 | 1,114 | 1,111 | 1,056 | 832 | 1,165 | 1,293 | 1,382 | 1,315 | 1,271 | 1,310 | 1,070 | 1,215 |
| 2021 | 1,237 | 1,123 | 1,382 | 1,395 | 1,424 | 1,435 | 1,495 | 1,442 | 1,310 | 1,317 | 1,247 | 1,355 |
| 2022 | 1,225 | 1,139 | 1,370 | 1,261 | 1,357 | 1,342 | 1,414 | 1,410 | 1,292 | 1,407 | 1,335 | 1,297 |
| 2023 | 1,299 | 1,199 | 1,286 | 1,233 | 1,315 | 1,342 | 1,361 | 1,349 | 1,314 | 1,345 | 1,283 | 1,267 |
| 2024 | 1,220 | |||||||||||
| - = No Data Reported; -- = Not Applicable; NA = Not Available; W = Withheld to avoid disclosure of individual company data. |
| Release Date: 3/29/2024 |
| Next Release Date: 4/30/2024 |