|
Download Data (XLS File) |
|
||||||||
|
||||||||
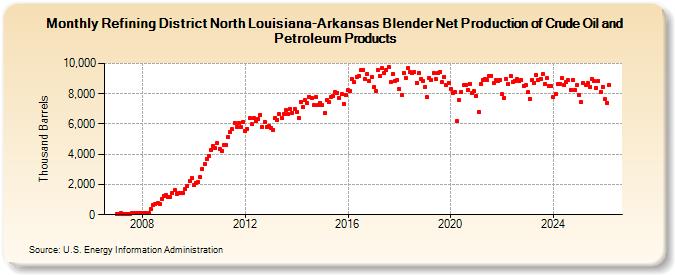
| Refining District North Louisiana-Arkansas Blender Net Production of Crude Oil and Petroleum Products (Thousand Barrels) | ||||||||
| Year | Jan | Feb | Mar | Apr | May | Jun | Jul | Aug | Sep | Oct | Nov | Dec |
|---|---|---|---|---|---|---|---|---|---|---|---|---|
| 2007 | 68 | 72 | 91 | 62 | 68 | 52 | 69 | 88 | 105 | 139 | 143 | 140 |
| 2008 | 116 | 108 | 120 | 116 | 351 | 642 | 735 | 753 | 712 | 1,060 | 1,210 | 1,317 |
| 2009 | 1,170 | 1,161 | 1,457 | 1,620 | 1,395 | 1,451 | 1,407 | 1,431 | 1,708 | 1,920 | 2,235 | 2,401 |
| 2010 | 1,936 | 2,103 | 2,182 | 2,474 | 3,021 | 3,324 | 3,681 | 3,893 | 4,271 | 4,572 | 4,391 | 4,745 |
| 2011 | 4,332 | 4,234 | 4,599 | 4,601 | 5,145 | 5,484 | 5,636 | 6,084 | 5,816 | 6,040 | 5,788 | 6,141 |
| 2012 | 5,540 | 5,695 | 6,374 | 5,980 | 6,371 | 6,224 | 6,335 | 6,616 | 5,786 | 6,139 | 5,812 | 5,842 |
| 2013 | 5,734 | 5,615 | 6,422 | 6,294 | 6,635 | 6,403 | 6,684 | 6,894 | 6,648 | 7,012 | 6,735 | 6,989 |
| 2014 | 6,794 | 6,426 | 7,466 | 7,153 | 7,554 | 7,367 | 7,812 | 7,720 | 7,222 | 7,778 | 7,243 | 7,413 |
| 2015 | 7,232 | 6,709 | 7,584 | 7,436 | 7,764 | 7,819 | 8,102 | 8,073 | 7,695 | 7,967 | 7,327 | 7,928 |
| 2016 | 8,238 | 8,183 | 8,961 | 8,758 | 9,139 | 9,177 | 9,549 | 9,572 | 8,958 | 9,309 | 8,833 | 9,090 |
| 2017 | 8,440 | 8,180 | 9,596 | 9,191 | 9,697 | 9,342 | 9,553 | 9,754 | 8,754 | 9,306 | 8,869 | 8,904 |
| 2018 | 8,318 | 7,894 | 9,368 | 9,043 | 9,691 | 9,407 | 9,357 | 9,437 | 8,736 | 9,371 | 8,971 | 8,848 |
| 2019 | 8,462 | 7,757 | 9,030 | 8,909 | 9,363 | 8,951 | 9,345 | 9,440 | 8,746 | 9,108 | 8,601 | 8,727 |
| 2020 | 8,326 | 8,049 | 8,091 | 6,178 | 7,583 | 8,133 | 8,567 | 8,546 | 8,261 | 8,646 | 8,026 | 8,152 |
| 2021 | 7,818 | 6,801 | 8,612 | 8,908 | 8,998 | 8,887 | 9,142 | 9,197 | 8,732 | 8,895 | 8,815 | 8,934 |
| 2022 | 7,949 | 7,721 | 8,987 | 8,660 | 9,165 | 8,786 | 8,860 | 8,945 | 8,831 | 8,907 | 8,540 | 8,558 |
| 2023 | 8,083 | 7,682 | 8,938 | 8,725 | 9,244 | 8,938 | 9,003 | 9,332 | 8,653 | 9,025 | 8,511 | 8,478 |
| 2024 | 7,768 | |||||||||||
| - = No Data Reported; -- = Not Applicable; NA = Not Available; W = Withheld to avoid disclosure of individual company data. |
| Release Date: 3/29/2024 |
| Next Release Date: 4/30/2024 |