|
Download Data (XLS File) |
|
||||||||
|
||||||||
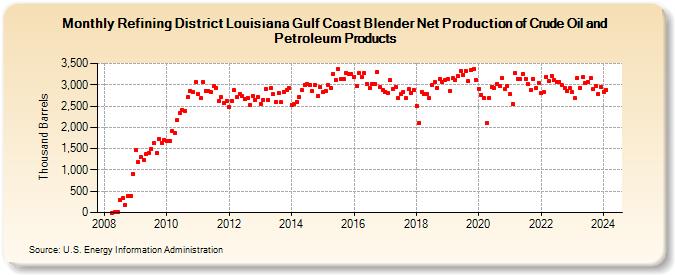
| Refining District Louisiana Gulf Coast Blender Net Production of Crude Oil and Petroleum Products (Thousand Barrels) | ||||||||
| Year | Jan | Feb | Mar | Apr | May | Jun | Jul | Aug | Sep | Oct | Nov | Dec |
|---|---|---|---|---|---|---|---|---|---|---|---|---|
| 2008 | 1 | 2 | 14 | 292 | 340 | 183 | 393 | 383 | 908 | |||
| 2009 | 1,464 | 1,181 | 1,303 | 1,237 | 1,365 | 1,405 | 1,498 | 1,626 | 1,397 | 1,729 | 1,644 | 1,705 |
| 2010 | 1,682 | 1,674 | 1,913 | 1,878 | 2,163 | 2,334 | 2,416 | 2,383 | 2,702 | 2,854 | 2,829 | 3,055 |
| 2011 | 2,795 | 2,682 | 3,066 | 2,856 | 2,851 | 2,823 | 2,965 | 2,929 | 2,629 | 2,703 | 2,562 | 2,627 |
| 2012 | 2,470 | 2,629 | 2,867 | 2,704 | 2,778 | 2,728 | 2,660 | 2,692 | 2,521 | 2,737 | 2,638 | 2,706 |
| 2013 | 2,551 | 2,651 | 2,897 | 2,651 | 2,918 | 2,777 | 2,596 | 2,808 | 2,588 | 2,833 | 2,871 | 2,913 |
| 2014 | 2,532 | 2,555 | 2,601 | 2,717 | 2,867 | 2,997 | 3,015 | 3,005 | 2,855 | 2,999 | 2,741 | 2,954 |
| 2015 | 2,827 | 2,852 | 2,999 | 2,932 | 3,255 | 3,109 | 3,360 | 3,146 | 3,127 | 3,286 | 3,249 | 3,247 |
| 2016 | 3,194 | 2,978 | 3,273 | 3,177 | 3,269 | 3,008 | 2,918 | 3,030 | 3,022 | 3,302 | 2,937 | 2,888 |
| 2017 | 2,839 | 2,812 | 3,107 | 2,911 | 2,942 | 2,695 | 2,794 | 2,834 | 2,678 | 2,895 | 2,813 | 2,870 |
| 2018 | 2,509 | 2,111 | 2,836 | 2,776 | 2,789 | 2,678 | 2,994 | 3,064 | 2,934 | 3,133 | 3,065 | 3,103 |
| 2019 | 3,133 | 2,861 | 3,152 | 3,122 | 3,199 | 3,329 | 3,241 | 3,324 | 3,088 | 3,351 | 3,362 | 3,120 |
| 2020 | 2,908 | 2,754 | 2,693 | 2,099 | 2,693 | 2,959 | 2,919 | 3,028 | 2,974 | 3,167 | 2,895 | 2,977 |
| 2021 | 2,787 | 2,553 | 3,273 | 3,133 | 3,131 | 3,264 | 3,143 | 3,016 | 2,874 | 3,142 | 2,921 | 3,052 |
| 2022 | 2,801 | 2,820 | 3,190 | 3,086 | 3,217 | 3,117 | 3,071 | 3,067 | 2,987 | 2,920 | 2,852 | 2,915 |
| 2023 | 2,819 | 2,683 | 3,156 | 2,932 | 3,176 | 3,045 | 3,072 | 3,163 | 2,892 | 2,961 | 2,787 | 2,938 |
| 2024 | 2,837 | |||||||||||
| - = No Data Reported; -- = Not Applicable; NA = Not Available; W = Withheld to avoid disclosure of individual company data. |
| Release Date: 3/29/2024 |
| Next Release Date: 4/30/2024 |