|
Download Data (XLS File) |
|
||||||||
|
||||||||
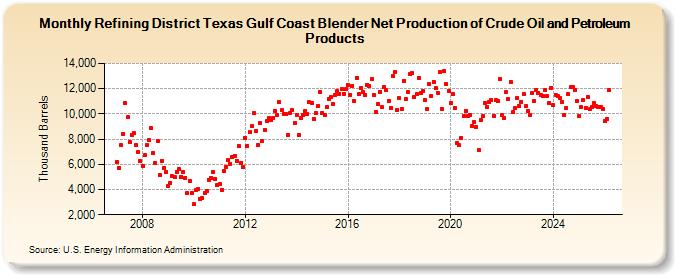
| Refining District Texas Gulf Coast Blender Net Production of Crude Oil and Petroleum Products (Thousand Barrels) | ||||||||
| Year | Jan | Feb | Mar | Apr | May | Jun | Jul | Aug | Sep | Oct | Nov | Dec |
|---|---|---|---|---|---|---|---|---|---|---|---|---|
| 2007 | 6,196 | 5,709 | 7,520 | 8,387 | 10,828 | 9,753 | 7,794 | 8,331 | 8,448 | 7,505 | 6,970 | 6,234 |
| 2008 | 5,896 | 6,709 | 7,549 | 7,965 | 8,848 | 6,922 | 6,086 | 7,886 | 5,166 | 6,289 | 5,737 | 5,379 |
| 2009 | 4,296 | 4,551 | 5,040 | 4,980 | 5,404 | 5,608 | 5,009 | 5,350 | 4,935 | 3,711 | 4,692 | 3,721 |
| 2010 | 2,817 | 3,936 | 4,016 | 3,240 | 3,290 | 3,761 | 3,864 | 4,791 | 4,932 | 5,406 | 4,865 | 4,354 |
| 2011 | 4,454 | 3,991 | 5,464 | 5,817 | 6,309 | 6,058 | 6,612 | 6,669 | 6,268 | 7,454 | 6,142 | 5,778 |
| 2012 | 8,122 | 7,435 | 8,556 | 9,019 | 10,067 | 8,634 | 7,558 | 9,306 | 7,864 | 8,745 | 9,415 | 9,664 |
| 2013 | 9,523 | 9,711 | 10,230 | 9,936 | 10,939 | 10,288 | 10,016 | 9,964 | 8,335 | 10,058 | 10,324 | 9,277 |
| 2014 | 9,941 | 8,339 | 9,676 | 9,931 | 10,256 | 9,993 | 10,920 | 10,894 | 9,616 | 10,078 | 10,607 | 11,729 |
| 2015 | 10,078 | 9,881 | 10,510 | 11,159 | 11,316 | 10,766 | 11,508 | 11,787 | 11,594 | 11,982 | 11,608 | 11,950 |
| 2016 | 12,293 | 11,518 | 12,236 | 11,035 | 12,874 | 11,575 | 12,085 | 11,719 | 11,490 | 12,317 | 12,234 | 12,759 |
| 2017 | 11,480 | 10,141 | 10,775 | 11,775 | 10,519 | 12,098 | 11,875 | 11,058 | 10,492 | 12,996 | 13,343 | 10,299 |
| 2018 | 11,237 | 10,386 | 12,632 | 11,168 | 11,720 | 13,146 | 13,222 | 11,340 | 11,577 | 12,868 | 11,697 | 11,801 |
| 2019 | 11,066 | 10,387 | 12,335 | 11,450 | 12,556 | 12,019 | 11,682 | 13,288 | 10,395 | 13,368 | 12,364 | 11,828 |
| 2020 | 10,857 | 11,587 | 10,450 | 7,651 | 7,531 | 8,125 | 9,808 | 10,247 | 9,823 | 9,941 | 9,077 | 9,353 |
| 2021 | 8,956 | 7,117 | 9,522 | 9,800 | 10,848 | 10,562 | 10,919 | 11,074 | 9,868 | 11,086 | 11,030 | 12,736 |
| 2022 | 9,896 | 9,686 | 11,715 | 11,168 | 12,542 | 10,115 | 10,455 | 11,236 | 10,600 | 10,946 | 11,617 | 10,623 |
| 2023 | 10,128 | 9,910 | 11,760 | 11,095 | 11,906 | 12,005 | 11,532 | 11,377 | 12,247 | 11,433 | 10,861 | 12,199 |
| 2024 | 10,673 | |||||||||||
| - = No Data Reported; -- = Not Applicable; NA = Not Available; W = Withheld to avoid disclosure of individual company data. |
| Release Date: 3/29/2024 |
| Next Release Date: 4/30/2024 |