|
Download Data (XLS File) |
|
||||||||
|
||||||||
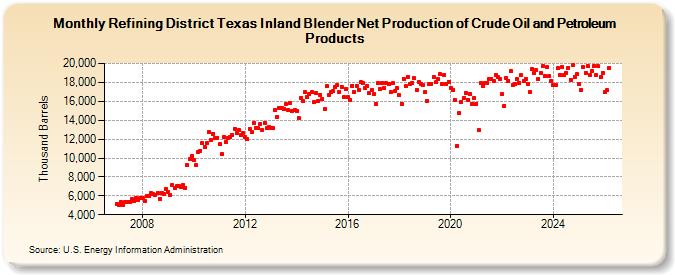
| Refining District Texas Inland Blender Net Production of Crude Oil and Petroleum Products (Thousand Barrels) | ||||||||
| Year | Jan | Feb | Mar | Apr | May | Jun | Jul | Aug | Sep | Oct | Nov | Dec |
|---|---|---|---|---|---|---|---|---|---|---|---|---|
| 2007 | 5,145 | 4,985 | 5,359 | 5,028 | 5,303 | 5,333 | 5,327 | 5,629 | 5,421 | 5,748 | 5,512 | 5,776 |
| 2008 | 5,730 | 5,478 | 5,939 | 5,991 | 6,309 | 6,165 | 6,122 | 6,266 | 5,709 | 6,299 | 6,221 | 6,769 |
| 2009 | 6,429 | 6,103 | 7,139 | 6,818 | 6,997 | 7,027 | 6,915 | 7,119 | 6,835 | 9,240 | 9,892 | 10,194 |
| 2010 | 9,825 | 9,222 | 10,649 | 10,774 | 11,542 | 11,197 | 11,550 | 12,743 | 11,886 | 12,583 | 12,091 | 12,148 |
| 2011 | 11,467 | 10,413 | 12,259 | 11,713 | 12,166 | 12,219 | 12,445 | 13,099 | 12,594 | 12,935 | 12,454 | 12,655 |
| 2012 | 12,270 | 11,999 | 13,121 | 12,737 | 13,693 | 13,210 | 13,137 | 13,599 | 12,954 | 13,732 | 13,167 | 13,291 |
| 2013 | 13,169 | 13,170 | 15,039 | 14,374 | 15,335 | 15,293 | 15,214 | 15,687 | 15,118 | 15,801 | 15,007 | 15,037 |
| 2014 | 15,015 | 14,202 | 16,399 | 15,982 | 16,930 | 16,451 | 16,755 | 16,934 | 15,917 | 16,853 | 16,056 | 16,701 |
| 2015 | 16,250 | 15,133 | 17,572 | 16,654 | 16,999 | 17,060 | 17,556 | 17,702 | 16,998 | 17,523 | 16,408 | 17,312 |
| 2016 | 16,427 | 16,163 | 17,652 | 16,974 | 17,642 | 17,225 | 17,998 | 17,929 | 17,354 | 17,632 | 16,872 | 17,167 |
| 2017 | 16,755 | 15,754 | 17,884 | 17,334 | 17,941 | 17,431 | 17,892 | 17,872 | 16,931 | 17,895 | 17,077 | 17,380 |
| 2018 | 16,634 | 15,748 | 18,411 | 17,568 | 18,597 | 17,861 | 17,965 | 18,424 | 17,217 | 18,048 | 17,866 | 17,775 |
| 2019 | 16,949 | 16,049 | 17,794 | 17,817 | 18,548 | 17,998 | 18,357 | 18,879 | 17,863 | 18,775 | 17,823 | 18,049 |
| 2020 | 17,415 | 17,214 | 16,131 | 11,277 | 14,746 | 15,972 | 16,394 | 16,926 | 16,182 | 16,782 | 15,741 | 16,374 |
| 2021 | 15,744 | 12,918 | 17,925 | 17,669 | 17,921 | 17,948 | 18,364 | 18,391 | 18,167 | 18,800 | 18,533 | 18,374 |
| 2022 | 16,749 | 15,536 | 18,441 | 18,199 | 19,161 | 17,734 | 17,826 | 18,359 | 17,981 | 18,740 | 18,170 | 18,373 |
| 2023 | 17,758 | 16,865 | 19,392 | 19,006 | 19,279 | 18,490 | 19,042 | 19,684 | 18,723 | 19,586 | 18,622 | 18,053 |
| 2024 | 17,727 | |||||||||||
| - = No Data Reported; -- = Not Applicable; NA = Not Available; W = Withheld to avoid disclosure of individual company data. |
| Release Date: 3/29/2024 |
| Next Release Date: 4/30/2024 |