|
Download Data (XLS File) |
|
||||||||
|
||||||||
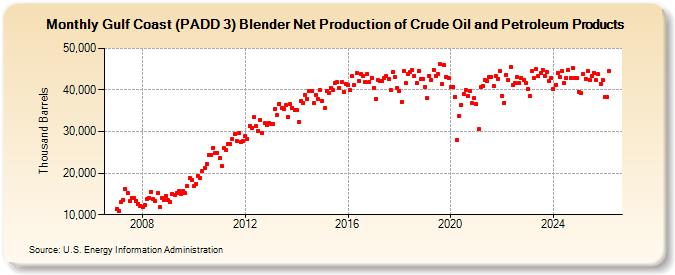
| Gulf Coast (PADD 3) Blender Net Production of Crude Oil and Petroleum Products (Thousand Barrels) | ||||||||
| Year | Jan | Feb | Mar | Apr | May | Jun | Jul | Aug | Sep | Oct | Nov | Dec |
|---|---|---|---|---|---|---|---|---|---|---|---|---|
| 2007 | 11,461 | 10,811 | 12,970 | 13,477 | 16,199 | 15,143 | 13,196 | 14,055 | 13,996 | 13,417 | 12,683 | 12,212 |
| 2008 | 11,802 | 12,358 | 13,666 | 14,120 | 15,550 | 13,773 | 13,283 | 15,298 | 11,831 | 14,116 | 13,633 | 14,458 |
| 2009 | 13,434 | 13,060 | 15,023 | 14,747 | 15,338 | 15,715 | 15,097 | 15,797 | 15,123 | 16,852 | 18,723 | 18,273 |
| 2010 | 16,828 | 17,389 | 19,293 | 18,918 | 20,617 | 21,174 | 22,144 | 24,418 | 24,419 | 26,111 | 24,826 | 24,919 |
| 2011 | 23,531 | 21,748 | 25,928 | 25,468 | 27,007 | 27,111 | 28,205 | 29,303 | 27,776 | 29,670 | 27,459 | 27,740 |
| 2012 | 28,932 | 28,233 | 31,405 | 30,928 | 33,405 | 31,318 | 30,222 | 32,733 | 29,692 | 31,956 | 31,536 | 32,009 |
| 2013 | 31,720 | 31,908 | 35,425 | 34,057 | 36,692 | 35,600 | 35,378 | 36,315 | 33,546 | 36,611 | 35,747 | 35,079 |
| 2014 | 35,122 | 32,301 | 37,328 | 36,944 | 38,852 | 37,946 | 39,744 | 39,829 | 36,774 | 38,865 | 37,727 | 39,931 |
| 2015 | 37,465 | 35,545 | 39,840 | 39,275 | 40,461 | 39,889 | 41,703 | 41,824 | 40,514 | 41,901 | 39,626 | 41,534 |
| 2016 | 41,200 | 39,890 | 43,308 | 41,076 | 44,141 | 42,166 | 43,759 | 43,379 | 41,964 | 43,807 | 41,927 | 42,940 |
| 2017 | 40,543 | 37,808 | 42,393 | 42,250 | 42,256 | 42,782 | 43,290 | 42,735 | 39,922 | 44,246 | 43,159 | 40,553 |
| 2018 | 39,762 | 37,166 | 44,459 | 41,644 | 43,947 | 44,225 | 44,761 | 43,451 | 41,563 | 44,605 | 42,693 | 42,624 |
| 2019 | 40,708 | 38,005 | 43,436 | 42,361 | 44,863 | 43,472 | 43,872 | 46,181 | 41,483 | 45,985 | 43,216 | 42,913 |
| 2020 | 40,620 | 40,715 | 38,421 | 28,037 | 33,718 | 36,482 | 39,070 | 40,062 | 38,511 | 39,846 | 36,809 | 38,071 |
| 2021 | 36,542 | 30,512 | 40,714 | 40,905 | 42,322 | 42,096 | 43,063 | 43,120 | 40,951 | 43,240 | 42,546 | 44,451 |
| 2022 | 38,620 | 36,902 | 43,703 | 42,374 | 45,442 | 41,094 | 41,626 | 43,017 | 41,691 | 42,920 | 42,514 | 41,766 |
| 2023 | 40,087 | 38,339 | 44,532 | 42,991 | 44,920 | 43,820 | 44,010 | 44,905 | 43,829 | 44,350 | 42,064 | 42,935 |
| 2024 | 40,225 | |||||||||||
| - = No Data Reported; -- = Not Applicable; NA = Not Available; W = Withheld to avoid disclosure of individual company data. |
| Release Date: 3/29/2024 |
| Next Release Date: 4/30/2024 |