|
Download Data (XLS File) |
|
||||||||
|
||||||||
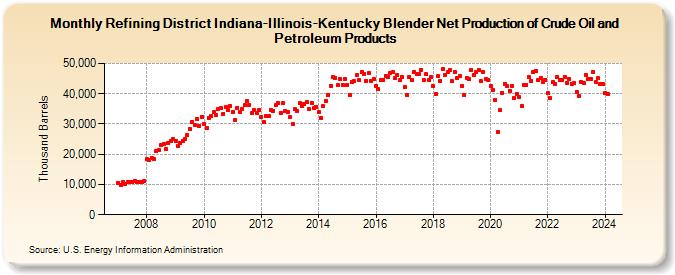
| Refining District Indiana-Illinois-Kentucky Blender Net Production of Crude Oil and Petroleum Products (Thousand Barrels) | ||||||||
| Year | Jan | Feb | Mar | Apr | May | Jun | Jul | Aug | Sep | Oct | Nov | Dec |
|---|---|---|---|---|---|---|---|---|---|---|---|---|
| 2007 | 10,636 | 9,863 | 10,652 | 10,083 | 10,780 | 10,732 | 10,758 | 11,046 | 10,792 | 10,957 | 10,948 | 11,088 |
| 2008 | 18,502 | 18,033 | 18,907 | 18,464 | 20,968 | 21,413 | 23,101 | 23,339 | 21,725 | 23,850 | 24,251 | 24,919 |
| 2009 | 24,289 | 22,720 | 23,789 | 24,510 | 24,987 | 26,270 | 28,346 | 30,778 | 29,684 | 31,678 | 29,367 | 32,436 |
| 2010 | 29,942 | 28,689 | 32,120 | 32,488 | 33,810 | 32,908 | 35,033 | 35,119 | 33,410 | 35,519 | 34,528 | 35,936 |
| 2011 | 34,110 | 31,457 | 35,394 | 33,797 | 34,984 | 36,110 | 37,539 | 36,195 | 33,567 | 34,561 | 33,612 | 34,491 |
| 2012 | 32,315 | 30,497 | 32,665 | 32,529 | 34,662 | 34,317 | 36,190 | 36,834 | 33,607 | 36,787 | 34,327 | 34,032 |
| 2013 | 32,253 | 30,056 | 34,830 | 34,239 | 36,782 | 35,988 | 36,558 | 37,217 | 35,015 | 37,067 | 35,353 | 35,720 |
| 2014 | 33,848 | 32,046 | 35,818 | 37,727 | 39,417 | 42,505 | 45,602 | 45,184 | 42,798 | 44,806 | 43,018 | 44,949 |
| 2015 | 42,974 | 39,614 | 43,990 | 44,043 | 46,060 | 44,511 | 47,115 | 46,563 | 44,230 | 46,728 | 44,298 | 44,829 |
| 2016 | 42,555 | 41,422 | 44,513 | 44,609 | 46,025 | 45,692 | 46,950 | 47,054 | 45,053 | 46,183 | 44,382 | 45,526 |
| 2017 | 42,309 | 39,506 | 45,633 | 44,402 | 47,183 | 46,573 | 46,514 | 47,956 | 44,509 | 46,364 | 44,629 | 45,370 |
| 2018 | 42,614 | 39,849 | 45,819 | 44,281 | 48,143 | 46,320 | 47,045 | 47,805 | 44,124 | 47,182 | 45,132 | 45,702 |
| 2019 | 42,666 | 39,654 | 45,359 | 44,945 | 47,983 | 46,296 | 47,245 | 47,721 | 44,101 | 47,067 | 44,905 | 44,657 |
| 2020 | 42,662 | 41,178 | 38,051 | 27,481 | 34,465 | 40,398 | 43,314 | 42,564 | 40,936 | 42,684 | 38,590 | 40,024 |
| 2021 | 38,782 | 35,955 | 43,010 | 43,026 | 45,514 | 44,270 | 47,168 | 47,530 | 44,423 | 45,200 | 43,898 | 44,654 |
| 2022 | 40,130 | 38,490 | 43,730 | 43,083 | 45,643 | 44,428 | 44,468 | 45,621 | 43,681 | 44,883 | 43,239 | 43,423 |
| 2023 | 40,633 | 39,279 | 43,990 | 43,520 | 46,351 | 44,726 | 44,984 | 47,105 | 43,839 | 45,054 | 43,281 | 43,355 |
| 2024 | 40,248 | |||||||||||
| - = No Data Reported; -- = Not Applicable; NA = Not Available; W = Withheld to avoid disclosure of individual company data. |
| Release Date: 3/29/2024 |
| Next Release Date: 4/30/2024 |