|
Download Data (XLS File) |
|
||||||||
|
||||||||
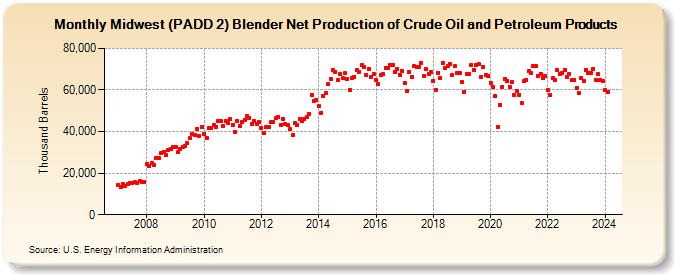
| Midwest (PADD 2) Blender Net Production of Crude Oil and Petroleum Products (Thousand Barrels) | ||||||||
| Year | Jan | Feb | Mar | Apr | May | Jun | Jul | Aug | Sep | Oct | Nov | Dec |
|---|---|---|---|---|---|---|---|---|---|---|---|---|
| 2007 | 14,403 | 13,386 | 14,579 | 13,983 | 14,752 | 15,144 | 15,310 | 15,710 | 15,322 | 16,107 | 15,629 | 15,757 |
| 2008 | 24,360 | 23,621 | 24,828 | 24,112 | 27,515 | 27,336 | 29,710 | 30,338 | 28,550 | 31,153 | 31,719 | 32,792 |
| 2009 | 32,535 | 29,960 | 31,735 | 32,349 | 33,093 | 34,321 | 36,820 | 38,791 | 38,122 | 41,413 | 37,800 | 42,049 |
| 2010 | 38,769 | 37,035 | 41,615 | 41,839 | 43,193 | 42,125 | 45,141 | 44,982 | 42,838 | 45,304 | 44,165 | 45,916 |
| 2011 | 43,301 | 40,023 | 44,964 | 42,890 | 44,584 | 45,678 | 47,524 | 46,666 | 43,490 | 45,012 | 43,741 | 44,607 |
| 2012 | 41,694 | 39,405 | 42,118 | 42,233 | 44,421 | 44,403 | 46,376 | 47,080 | 43,281 | 46,275 | 43,489 | 43,230 |
| 2013 | 41,094 | 38,376 | 44,097 | 43,328 | 45,865 | 44,910 | 45,976 | 46,762 | 48,589 | 57,557 | 54,470 | 55,192 |
| 2014 | 52,114 | 49,096 | 56,923 | 58,702 | 62,694 | 65,039 | 69,433 | 68,793 | 64,909 | 67,849 | 65,521 | 67,951 |
| 2015 | 65,165 | 60,217 | 65,823 | 66,344 | 69,817 | 68,784 | 71,958 | 70,812 | 67,225 | 70,066 | 66,040 | 67,893 |
| 2016 | 64,638 | 62,764 | 67,073 | 67,663 | 70,640 | 70,733 | 71,807 | 72,028 | 68,664 | 70,042 | 67,252 | 69,087 |
| 2017 | 63,560 | 59,422 | 68,613 | 66,355 | 71,404 | 71,140 | 70,874 | 72,775 | 66,892 | 69,871 | 67,613 | 68,758 |
| 2018 | 64,477 | 60,204 | 68,400 | 65,989 | 72,828 | 70,448 | 71,514 | 72,524 | 67,019 | 71,473 | 68,031 | 68,376 |
| 2019 | 64,018 | 59,223 | 67,781 | 67,450 | 72,162 | 69,465 | 72,141 | 72,284 | 66,449 | 71,051 | 67,378 | 66,883 |
| 2020 | 63,517 | 61,406 | 57,209 | 42,297 | 52,952 | 61,549 | 65,499 | 64,478 | 61,600 | 63,998 | 57,501 | 59,637 |
| 2021 | 57,648 | 53,710 | 64,153 | 64,831 | 69,116 | 68,203 | 71,598 | 71,508 | 66,928 | 67,906 | 65,771 | 66,705 |
| 2022 | 60,178 | 57,550 | 65,601 | 64,623 | 69,452 | 67,776 | 68,147 | 69,795 | 66,349 | 67,823 | 64,908 | 64,819 |
| 2023 | 61,153 | 58,778 | 65,685 | 64,550 | 69,840 | 68,074 | 68,033 | 70,171 | 64,976 | 67,456 | 64,732 | 64,204 |
| 2024 | 59,842 | |||||||||||
| - = No Data Reported; -- = Not Applicable; NA = Not Available; W = Withheld to avoid disclosure of individual company data. |
| Release Date: 3/29/2024 |
| Next Release Date: 4/30/2024 |