|
Download Data (XLS File) |
|
||||||||
|
||||||||
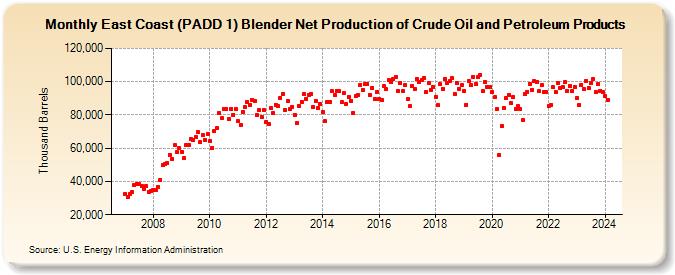
| East Coast (PADD 1) Blender Net Production of Crude Oil and Petroleum Products (Thousand Barrels) | ||||||||
| Year | Jan | Feb | Mar | Apr | May | Jun | Jul | Aug | Sep | Oct | Nov | Dec |
|---|---|---|---|---|---|---|---|---|---|---|---|---|
| 2007 | 32,602 | 30,503 | 32,370 | 33,425 | 37,626 | 38,574 | 38,315 | 37,186 | 35,666 | 37,119 | 33,799 | 34,295 |
| 2008 | 34,901 | 35,063 | 36,868 | 41,149 | 49,986 | 50,559 | 50,955 | 56,013 | 53,590 | 61,742 | 57,675 | 60,045 |
| 2009 | 57,877 | 54,024 | 61,827 | 62,206 | 65,560 | 65,111 | 66,965 | 69,563 | 63,643 | 67,728 | 65,197 | 68,682 |
| 2010 | 64,379 | 60,270 | 70,275 | 72,281 | 81,154 | 77,972 | 83,687 | 83,466 | 77,626 | 83,621 | 80,052 | 83,508 |
| 2011 | 76,165 | 73,845 | 81,990 | 84,645 | 87,622 | 86,084 | 89,165 | 88,643 | 80,143 | 83,032 | 78,964 | 82,757 |
| 2012 | 75,921 | 74,761 | 84,399 | 80,971 | 86,173 | 85,340 | 90,302 | 92,630 | 83,199 | 88,314 | 83,269 | 84,907 |
| 2013 | 80,021 | 74,936 | 85,497 | 87,996 | 92,299 | 89,771 | 92,251 | 92,589 | 84,749 | 88,530 | 84,140 | 86,344 |
| 2014 | 81,832 | 76,105 | 87,863 | 87,708 | 94,312 | 91,886 | 94,380 | 94,101 | 87,566 | 92,984 | 86,588 | 90,839 |
| 2015 | 88,570 | 81,160 | 91,181 | 91,934 | 98,071 | 95,131 | 98,443 | 98,752 | 92,131 | 96,364 | 89,568 | 93,922 |
| 2016 | 89,566 | 89,110 | 97,126 | 95,370 | 100,733 | 99,677 | 101,395 | 102,887 | 94,518 | 98,964 | 94,623 | 97,838 |
| 2017 | 89,396 | 85,090 | 97,629 | 95,837 | 101,859 | 99,639 | 101,153 | 102,460 | 93,668 | 99,167 | 94,834 | 96,761 |
| 2018 | 91,028 | 85,687 | 98,406 | 95,743 | 101,589 | 99,418 | 100,105 | 102,071 | 92,710 | 99,015 | 95,762 | 97,710 |
| 2019 | 94,273 | 86,264 | 100,315 | 97,895 | 102,843 | 98,748 | 102,729 | 104,209 | 94,261 | 100,082 | 96,723 | 96,722 |
| 2020 | 93,853 | 90,532 | 83,448 | 56,020 | 73,318 | 84,284 | 90,166 | 92,235 | 86,937 | 90,830 | 83,444 | 85,202 |
| 2021 | 83,558 | 76,779 | 92,797 | 93,812 | 98,757 | 95,184 | 100,101 | 99,836 | 94,394 | 97,691 | 93,801 | 93,833 |
| 2022 | 85,286 | 86,127 | 96,543 | 93,694 | 99,488 | 96,149 | 96,913 | 99,859 | 94,502 | 97,478 | 94,177 | 96,673 |
| 2023 | 90,240 | 85,840 | 98,238 | 95,438 | 100,628 | 96,065 | 99,386 | 101,376 | 93,783 | 98,666 | 94,633 | 93,654 |
| 2024 | 91,368 | |||||||||||
| - = No Data Reported; -- = Not Applicable; NA = Not Available; W = Withheld to avoid disclosure of individual company data. |
| Release Date: 3/29/2024 |
| Next Release Date: 4/30/2024 |