|
Download Data (XLS File) |
|
||||||||
|
||||||||
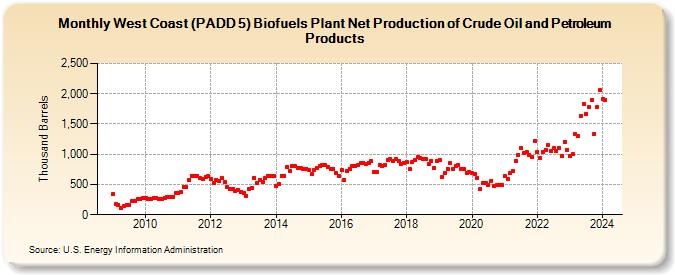
| West Coast (PADD 5) Biofuels Plant Net Production of Crude Oil and Petroleum Products (Thousand Barrels) | ||||||||
| Year | Jan | Feb | Mar | Apr | May | Jun | Jul | Aug | Sep | Oct | Nov | Dec |
|---|---|---|---|---|---|---|---|---|---|---|---|---|
| 2009 | 339 | 181 | 165 | 105 | 144 | 168 | 160 | 222 | 231 | 255 | 252 | 270 |
| 2010 | 280 | 255 | 265 | 276 | 284 | 263 | 268 | 284 | 290 | 285 | 291 | 360 |
| 2011 | 355 | 373 | 464 | 456 | 577 | 647 | 643 | 641 | 601 | 595 | 627 | 635 |
| 2012 | 596 | 517 | 570 | 552 | 612 | 546 | 459 | 424 | 422 | 384 | 409 | 381 |
| 2013 | 358 | 316 | 422 | 446 | 613 | 522 | 579 | 537 | 599 | 645 | 635 | 646 |
| 2014 | 474 | 502 | 645 | 646 | 791 | 726 | 798 | 798 | 779 | 766 | 759 | 763 |
| 2015 | 740 | 667 | 741 | 772 | 803 | 818 | 816 | 785 | 756 | 761 | 690 | 633 |
| 2016 | 742 | 582 | 719 | 759 | 799 | 805 | 821 | 851 | 861 | 839 | 861 | 883 |
| 2017 | 709 | 705 | 819 | 805 | 828 | 912 | 913 | 887 | 913 | 887 | 841 | 856 |
| 2018 | 866 | 754 | 868 | 898 | 954 | 931 | 929 | 919 | 833 | 893 | 778 | 891 |
| 2019 | 909 | 624 | 684 | 757 | 853 | 751 | 806 | 819 | 749 | 752 | 689 | 711 |
| 2020 | 687 | 669 | 614 | 420 | 524 | 527 | 492 | 564 | 476 | 491 | 493 | 498 |
| 2021 | 639 | 591 | 683 | 726 | 890 | 995 | 1,101 | 1,021 | 1,033 | 991 | 951 | 1,218 |
| 2022 | 1,033 | 938 | 1,033 | 1,075 | 1,155 | 1,057 | 1,098 | 1,053 | 1,106 | 978 | 1,201 | 1,072 |
| 2023 | 971 | 996 | 1,332 | 1,302 | 1,624 | 1,837 | 1,672 | 1,777 | 1,900 | 1,339 | 1,786 | 2,056 |
| 2024 | 1,912 | |||||||||||
| - = No Data Reported; -- = Not Applicable; NA = Not Available; W = Withheld to avoid disclosure of individual company data. |
| Release Date: 3/29/2024 |
| Next Release Date: 4/30/2024 |