|
Download Data (XLS File) |
|
||||||||
|
||||||||
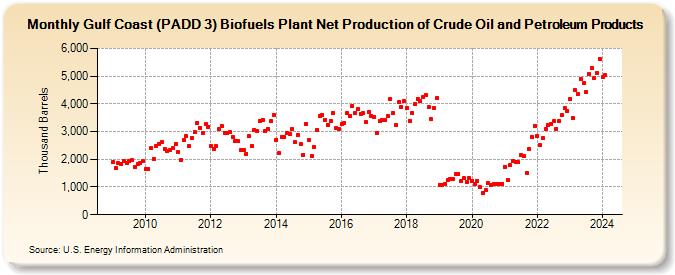
| Gulf Coast (PADD 3) Biofuels Plant Net Production of Crude Oil and Petroleum Products (Thousand Barrels) | ||||||||
| Year | Jan | Feb | Mar | Apr | May | Jun | Jul | Aug | Sep | Oct | Nov | Dec |
|---|---|---|---|---|---|---|---|---|---|---|---|---|
| 2009 | 1,901 | 1,679 | 1,854 | 1,824 | 1,938 | 1,870 | 1,926 | 1,962 | 1,717 | 1,812 | 1,869 | 1,920 |
| 2010 | 1,659 | 1,645 | 2,392 | 2,012 | 2,485 | 2,565 | 2,607 | 2,372 | 2,299 | 2,324 | 2,414 | 2,543 |
| 2011 | 2,272 | 1,991 | 2,682 | 2,825 | 2,474 | 2,785 | 2,973 | 3,320 | 3,135 | 2,955 | 3,271 | 3,179 |
| 2012 | 2,496 | 2,388 | 2,474 | 3,080 | 3,194 | 2,959 | 2,944 | 2,983 | 2,807 | 2,671 | 2,650 | 2,323 |
| 2013 | 2,318 | 2,204 | 2,824 | 2,482 | 3,055 | 3,022 | 3,391 | 3,418 | 3,005 | 3,089 | 3,377 | 3,600 |
| 2014 | 2,711 | 2,220 | 2,809 | 2,796 | 2,947 | 2,895 | 3,087 | 2,608 | 2,878 | 2,538 | 2,159 | 3,283 |
| 2015 | 2,697 | 2,108 | 2,454 | 3,067 | 3,554 | 3,597 | 3,428 | 3,247 | 3,385 | 3,661 | 3,123 | 3,095 |
| 2016 | 3,271 | 3,300 | 3,656 | 3,554 | 3,917 | 3,686 | 3,800 | 3,638 | 3,656 | 3,352 | 3,707 | 3,570 |
| 2017 | 3,533 | 2,954 | 3,389 | 3,433 | 3,415 | 3,565 | 4,181 | 3,659 | 3,227 | 4,061 | 3,896 | 4,113 |
| 2018 | 3,841 | 3,396 | 3,661 | 3,982 | 4,178 | 4,102 | 4,248 | 4,316 | 3,890 | 3,437 | 3,835 | 4,196 |
| 2019 | 1,087 | 1,063 | 1,117 | 1,261 | 1,290 | 1,276 | 1,455 | 1,460 | 1,219 | 1,308 | 1,190 | 1,311 |
| 2020 | 1,220 | 1,116 | 1,224 | 989 | 794 | 897 | 1,134 | 1,075 | 1,107 | 1,118 | 1,090 | 1,109 |
| 2021 | 1,737 | 1,262 | 1,785 | 1,924 | 1,918 | 1,884 | 2,158 | 2,101 | 1,498 | 2,373 | 2,796 | 3,210 |
| 2022 | 2,847 | 2,513 | 2,759 | 3,089 | 3,223 | 3,266 | 3,365 | 3,103 | 3,368 | 3,584 | 3,852 | 3,749 |
| 2023 | 4,168 | 3,499 | 4,487 | 4,359 | 4,894 | 4,739 | 4,420 | 5,076 | 5,307 | 4,932 | 5,119 | 5,614 |
| 2024 | 4,965 | |||||||||||
| - = No Data Reported; -- = Not Applicable; NA = Not Available; W = Withheld to avoid disclosure of individual company data. |
| Release Date: 3/29/2024 |
| Next Release Date: 4/30/2024 |