|
Download Data (XLS File) |
|
||||||||
|
||||||||
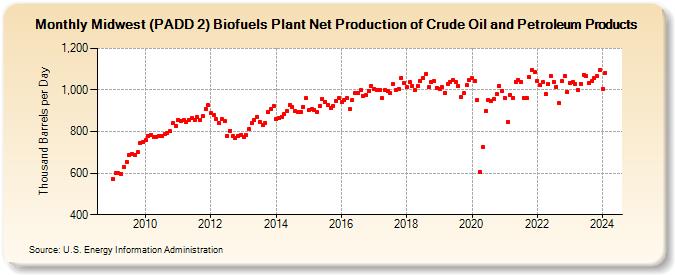
| Midwest (PADD 2) Biofuels Plant Net Production of Crude Oil and Petroleum Products (Thousand Barrels per Day) | ||||||||
| Year | Jan | Feb | Mar | Apr | May | Jun | Jul | Aug | Sep | Oct | Nov | Dec |
|---|---|---|---|---|---|---|---|---|---|---|---|---|
| 2009 | 571 | 600 | 599 | 598 | 629 | 655 | 688 | 694 | 688 | 700 | 743 | 748 |
| 2010 | 758 | 778 | 785 | 773 | 775 | 781 | 777 | 788 | 794 | 801 | 839 | 829 |
| 2011 | 857 | 849 | 857 | 847 | 857 | 864 | 856 | 869 | 857 | 873 | 909 | 926 |
| 2012 | 889 | 878 | 858 | 843 | 860 | 849 | 780 | 804 | 777 | 768 | 779 | 784 |
| 2013 | 773 | 782 | 810 | 840 | 855 | 870 | 848 | 831 | 842 | 892 | 907 | 923 |
| 2014 | 860 | 863 | 872 | 884 | 899 | 928 | 917 | 898 | 893 | 895 | 919 | 960 |
| 2015 | 905 | 908 | 906 | 892 | 924 | 957 | 941 | 927 | 912 | 922 | 948 | 962 |
| 2016 | 941 | 952 | 960 | 907 | 951 | 984 | 985 | 999 | 972 | 974 | 994 | 1,020 |
| 2017 | 1,005 | 998 | 998 | 959 | 998 | 995 | 985 | 1,030 | 998 | 1,007 | 1,059 | 1,032 |
| 2018 | 1,014 | 1,036 | 1,021 | 998 | 1,020 | 1,041 | 1,057 | 1,075 | 1,013 | 1,036 | 1,041 | 1,011 |
| 2019 | 1,004 | 1,012 | 986 | 1,028 | 1,040 | 1,047 | 1,039 | 1,018 | 966 | 985 | 1,022 | 1,048 |
| 2020 | 1,056 | 1,043 | 953 | 605 | 727 | 898 | 953 | 947 | 957 | 980 | 1,018 | 996 |
| 2021 | 962 | 848 | 978 | 963 | 1,040 | 1,048 | 1,038 | 963 | 960 | 1,062 | 1,095 | 1,086 |
| 2022 | 1,043 | 1,022 | 1,038 | 981 | 1,029 | 1,065 | 1,040 | 1,015 | 937 | 1,041 | 1,068 | 991 |
| 2023 | 1,035 | 1,039 | 1,027 | 1,002 | 1,031 | 1,074 | 1,067 | 1,034 | 1,041 | 1,057 | 1,067 | 1,096 |
| 2024 | 1,005 | |||||||||||
| - = No Data Reported; -- = Not Applicable; NA = Not Available; W = Withheld to avoid disclosure of individual company data. |
| Release Date: 3/29/2024 |
| Next Release Date: 4/30/2024 |